Curated reference · GitHub · Finance
Zero Sum Market Heatmap
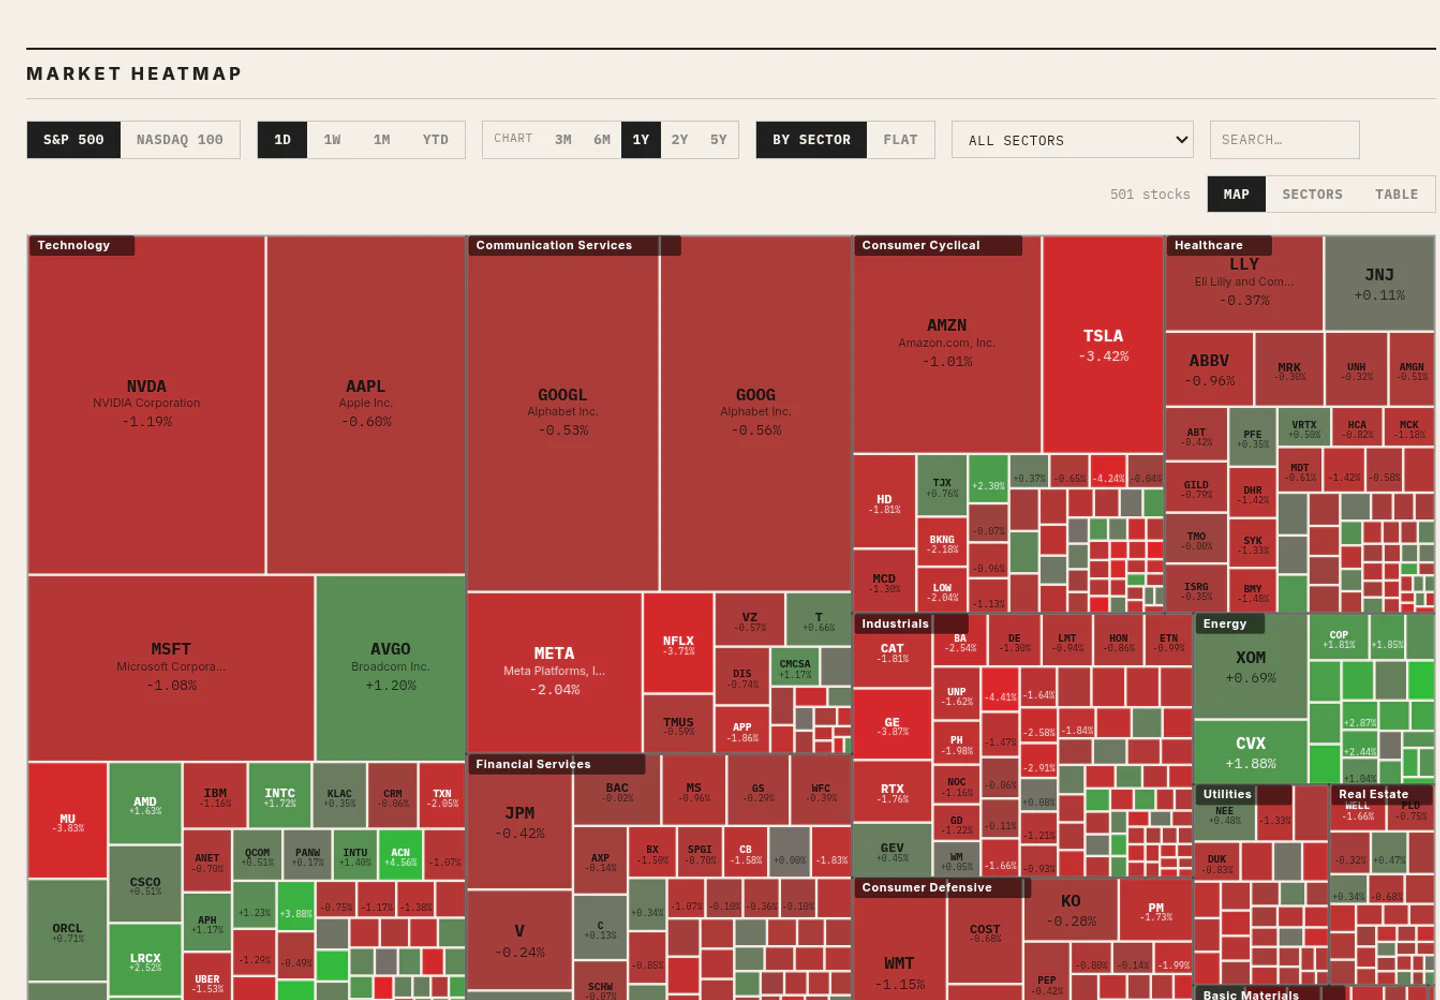
A market treemap that turns hundreds of securities into one red-and-green field with sector structure visible at a glance.
01 Critique
Why it works
- 01Area encodes market weight while color encodes direction, allowing two dimensions to be read immediately.
- 02Sector boundaries preserve hierarchy inside a visually dense field.
- 03The restrained control bar leaves almost the entire screen to the visualization.
02A Advantages
Strengths
- Instant market gestalt
- Excellent use of area
- Strong sector context
02B Constraints
Trade-offs
- Red-green coding needs accessible alternatives
- Small securities become difficult to select
03 Contribution
Why it belongs in the archive
Replaces a dashboard of summaries with one continuous, spatially encoded market surface.