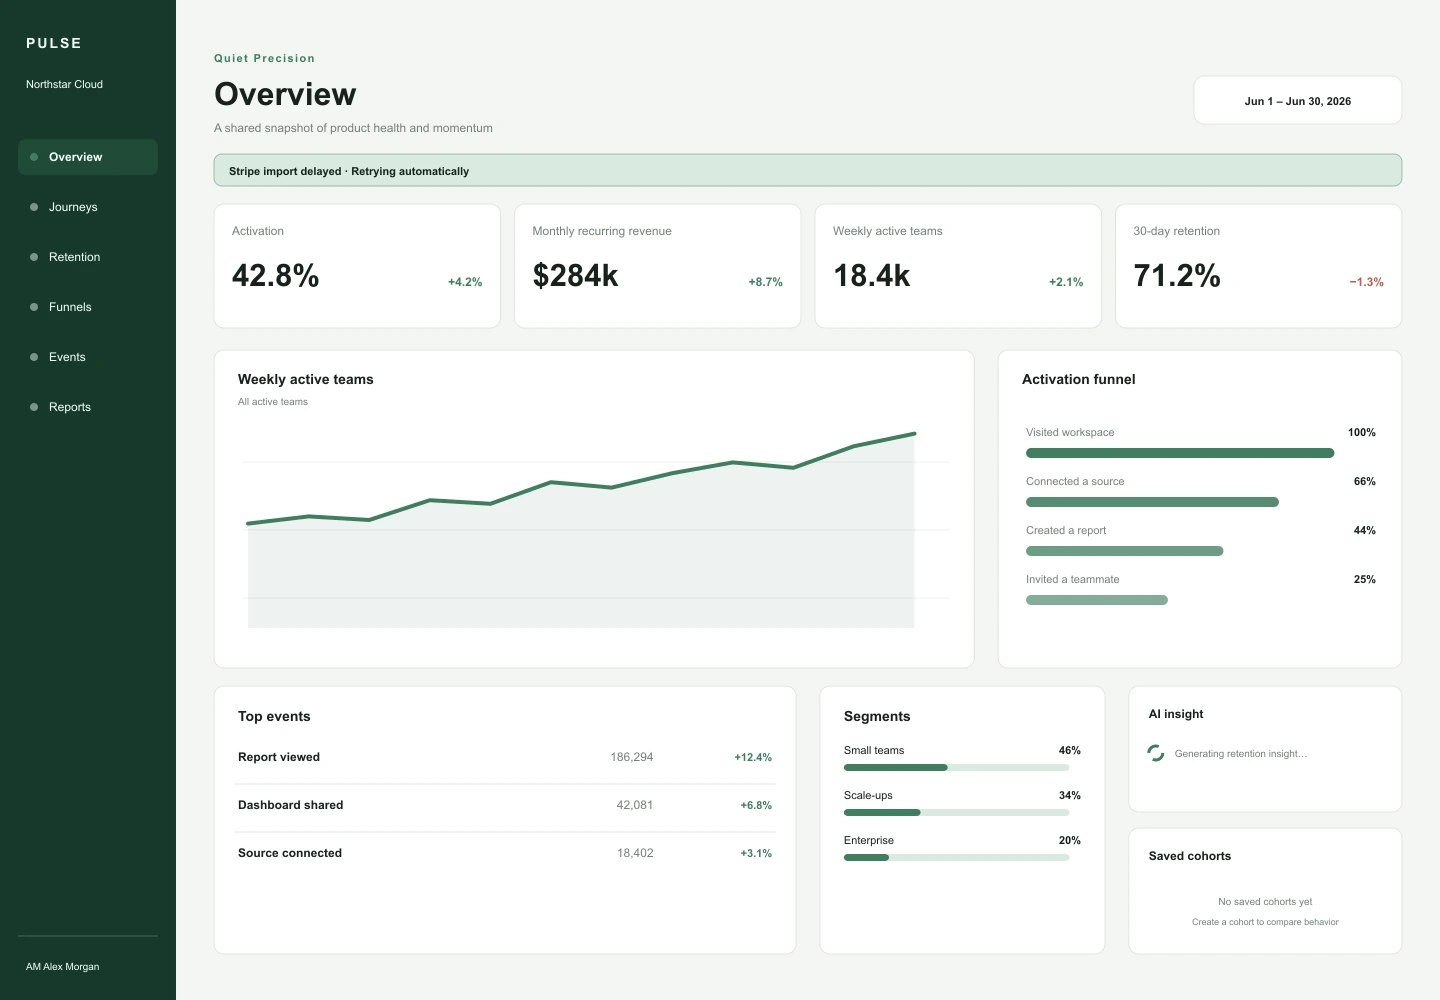
MinimalLightCalm
Quiet Precision
A restrained system that uses whitespace and one signal color to make dense product data feel calm.
Product Analytics
A comparative design archive
About this studyProduct analytics · Controlled comparison
Twelve visual systems applied to one product analytics workspace. The data stays fixed so the effect of hierarchy, density, typography, and color becomes visible.
12 studies
Showing 12 of 12 studies
A restrained system that uses whitespace and one signal color to make dense product data feel calm.
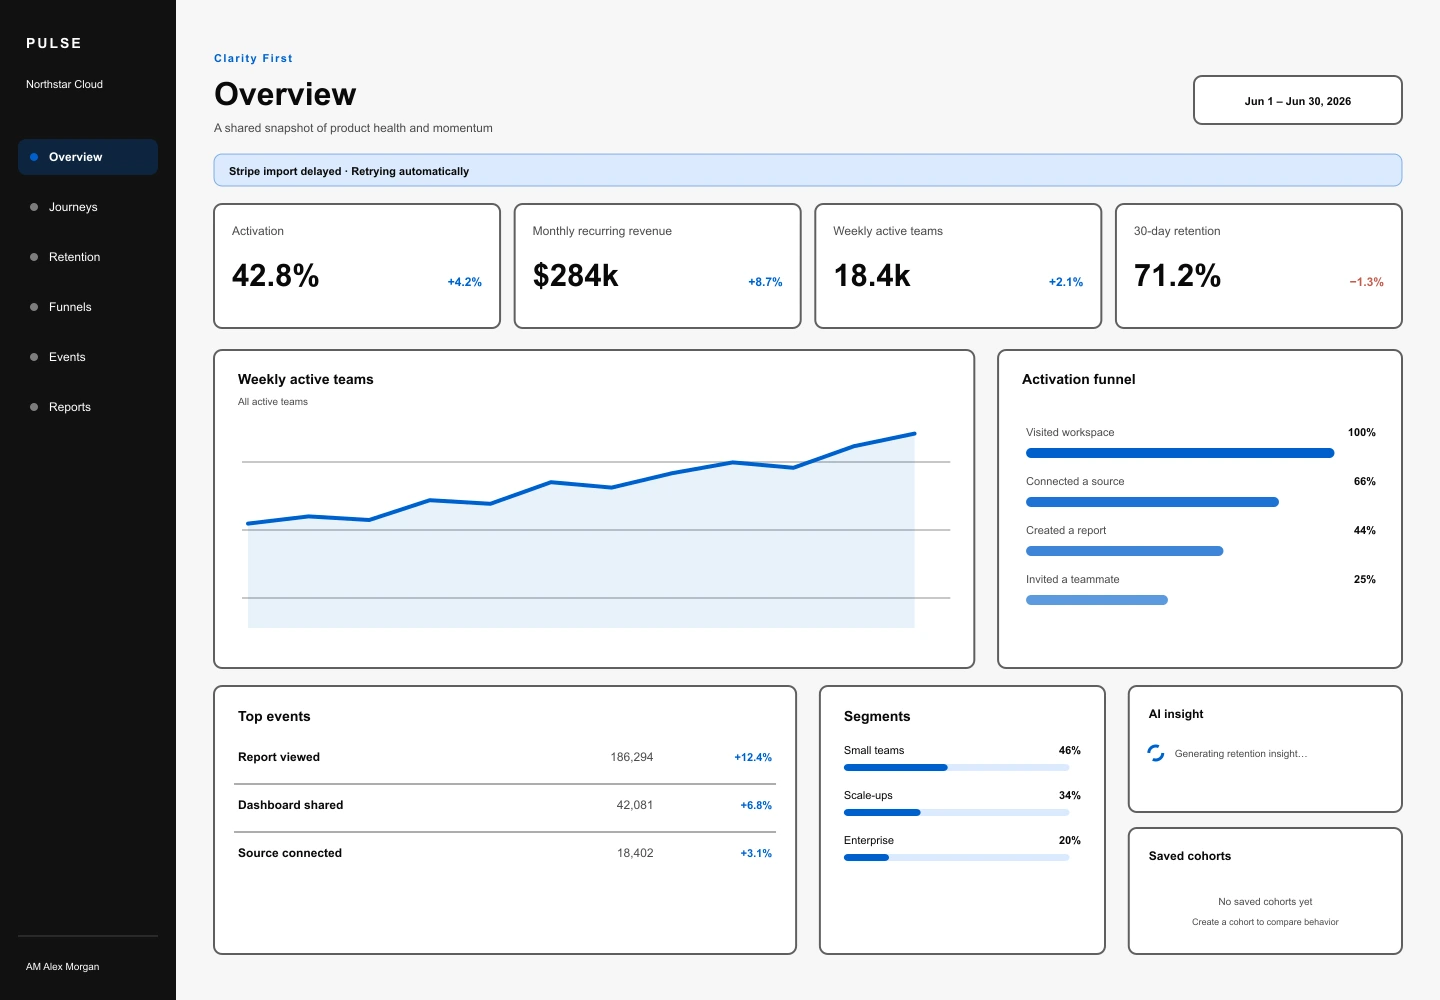
An accessibility-led system where strong boundaries, large labels, and redundant status cues prioritize confident reading.
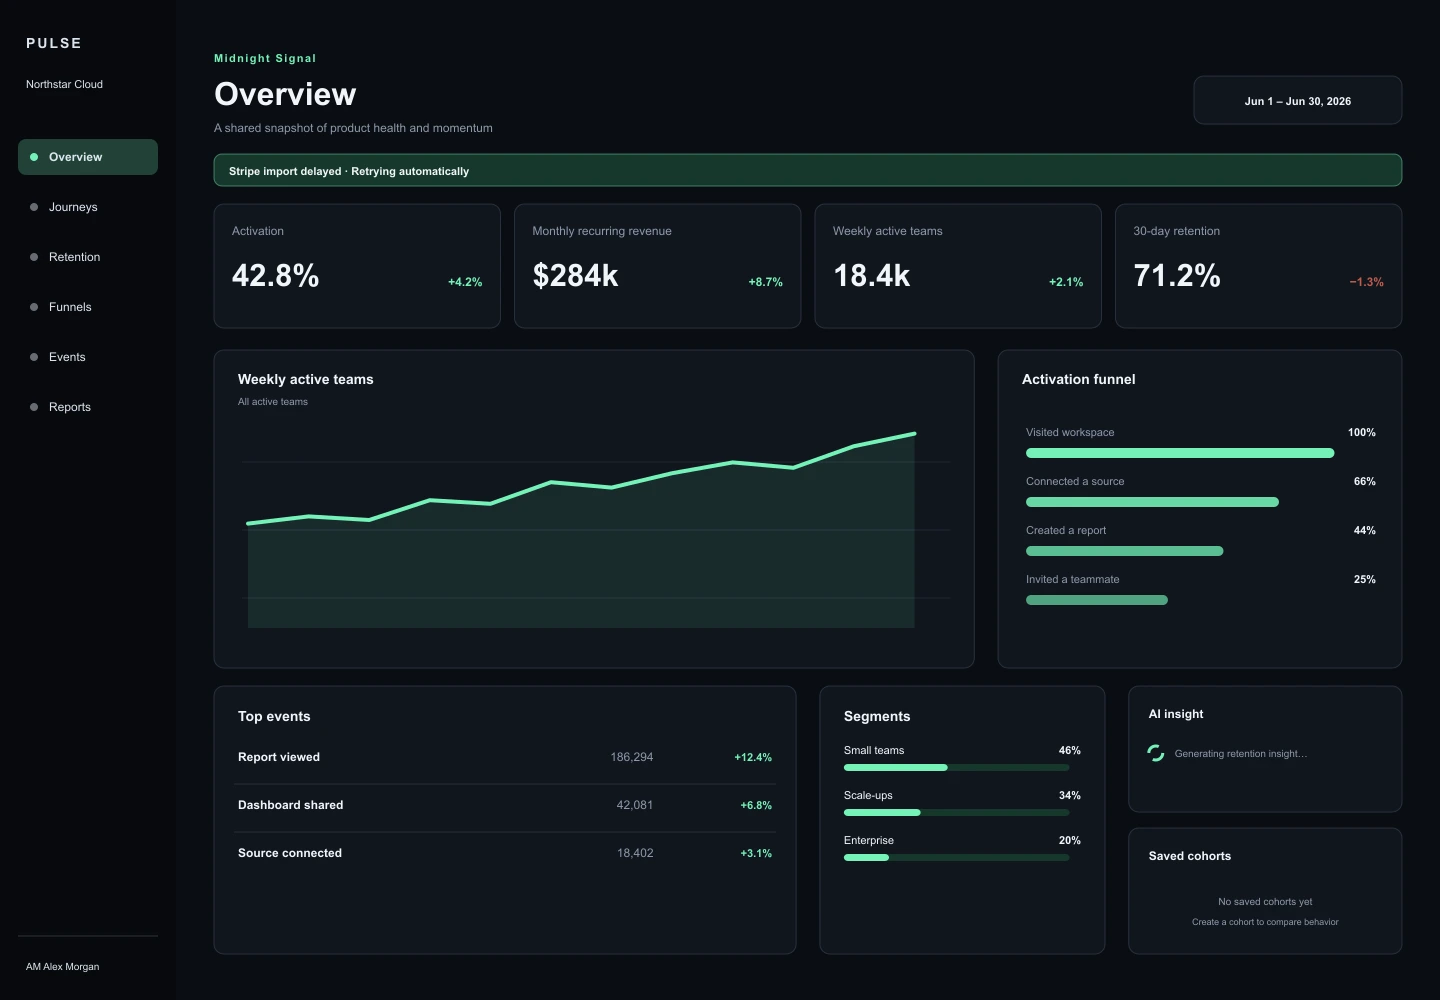
A dark operational workspace where mint signals and restrained borders preserve hierarchy without visual glare.
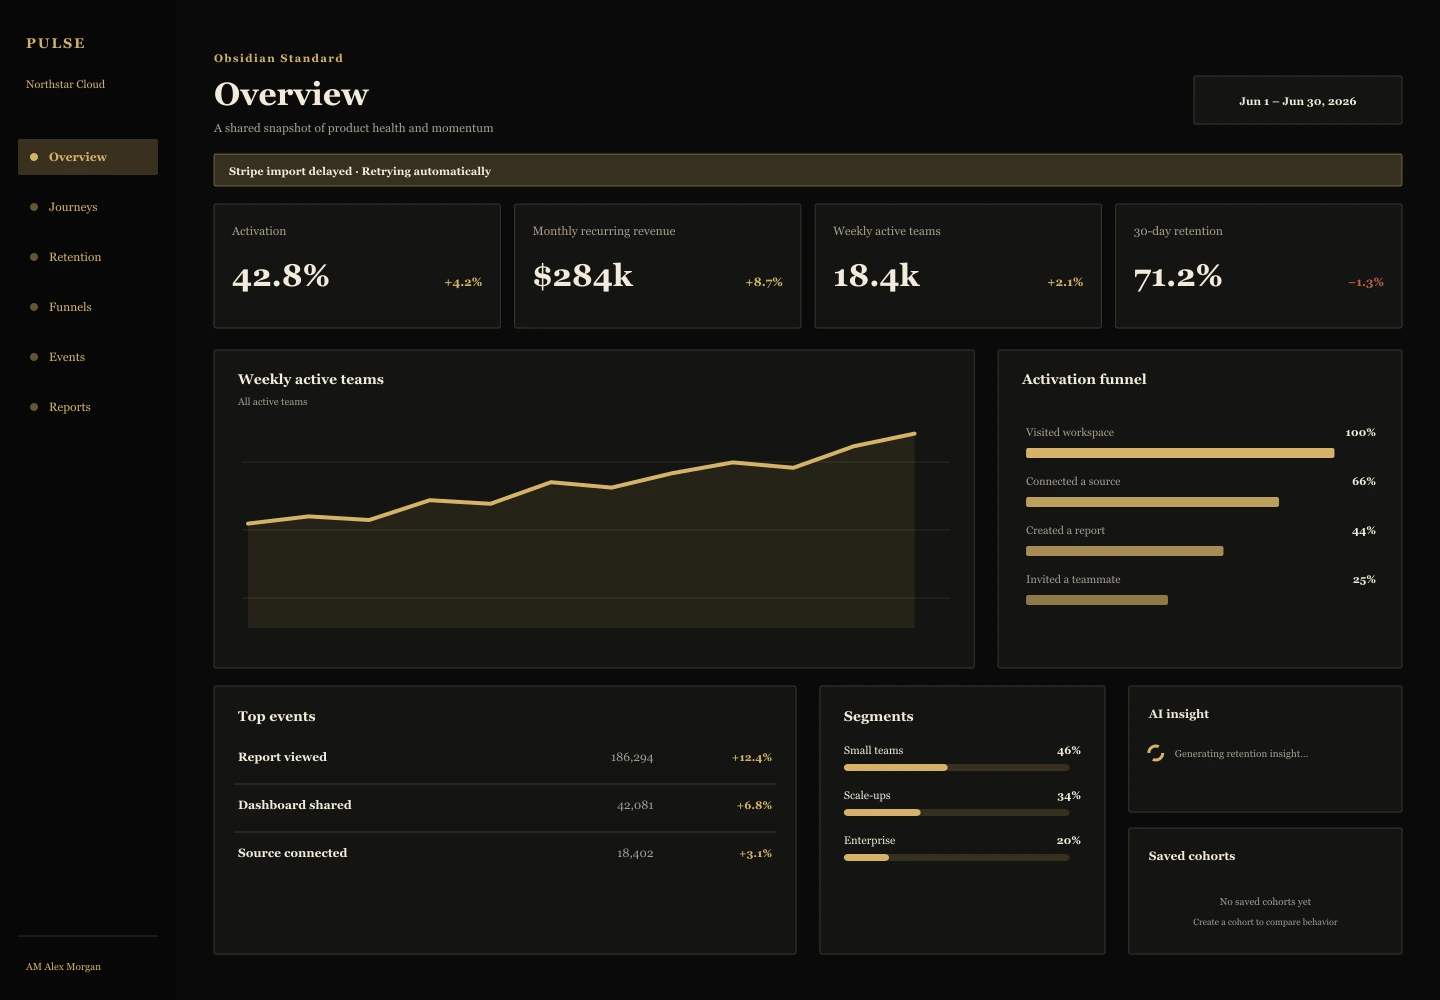
A restrained black-and-gold executive surface that gives recurring metrics the character of a premium instrument.
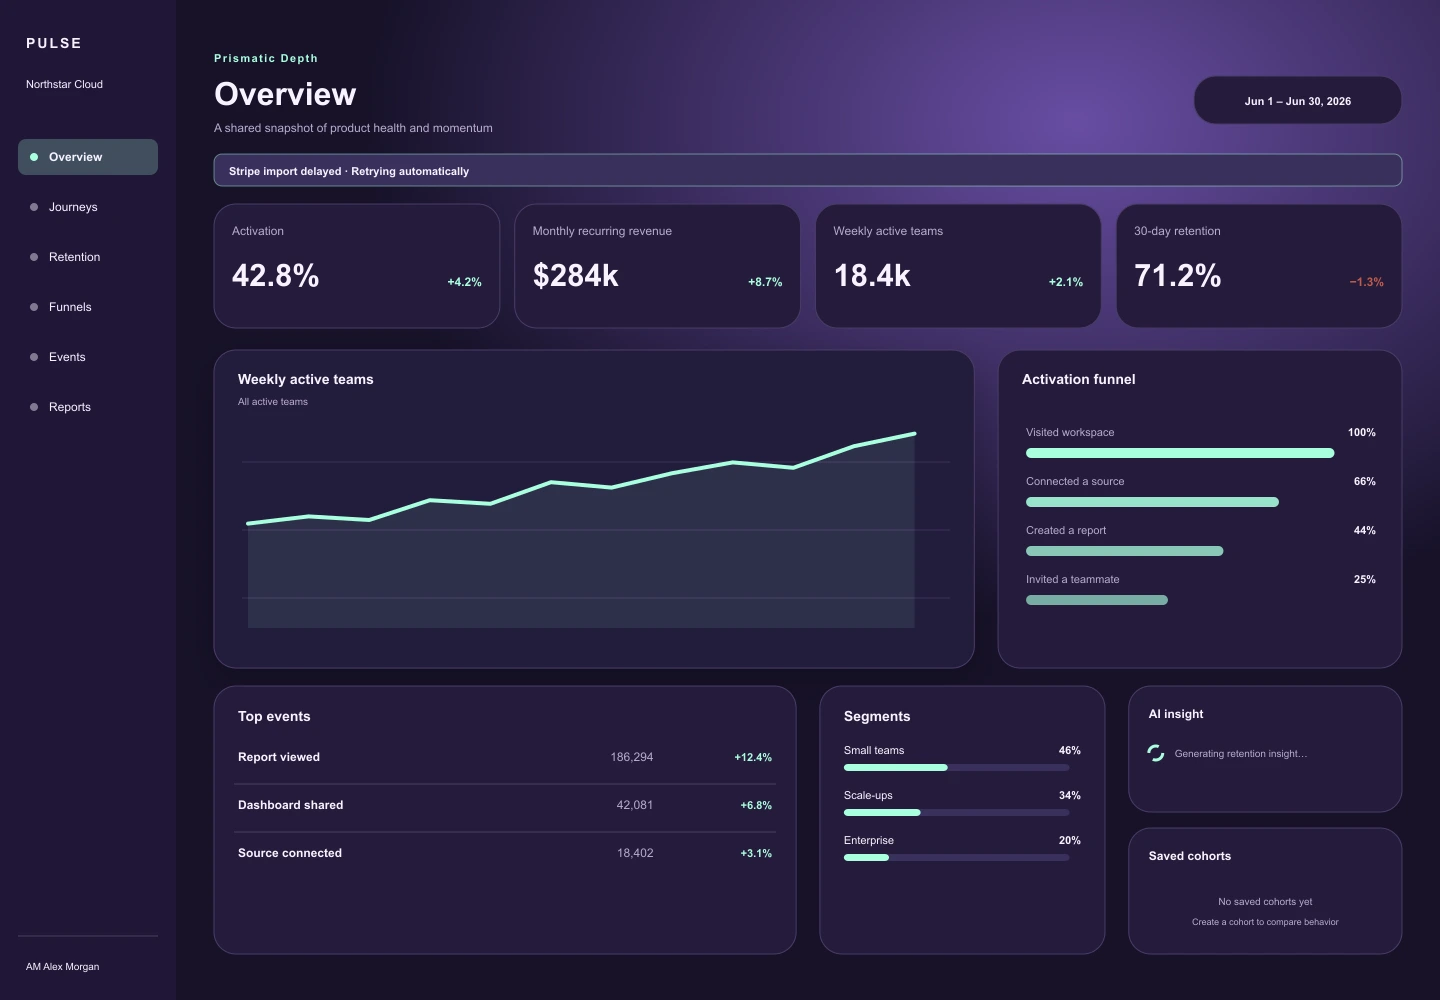
A dimensional dark interface that uses localized glow and translucent layers to frame the analytical surface.
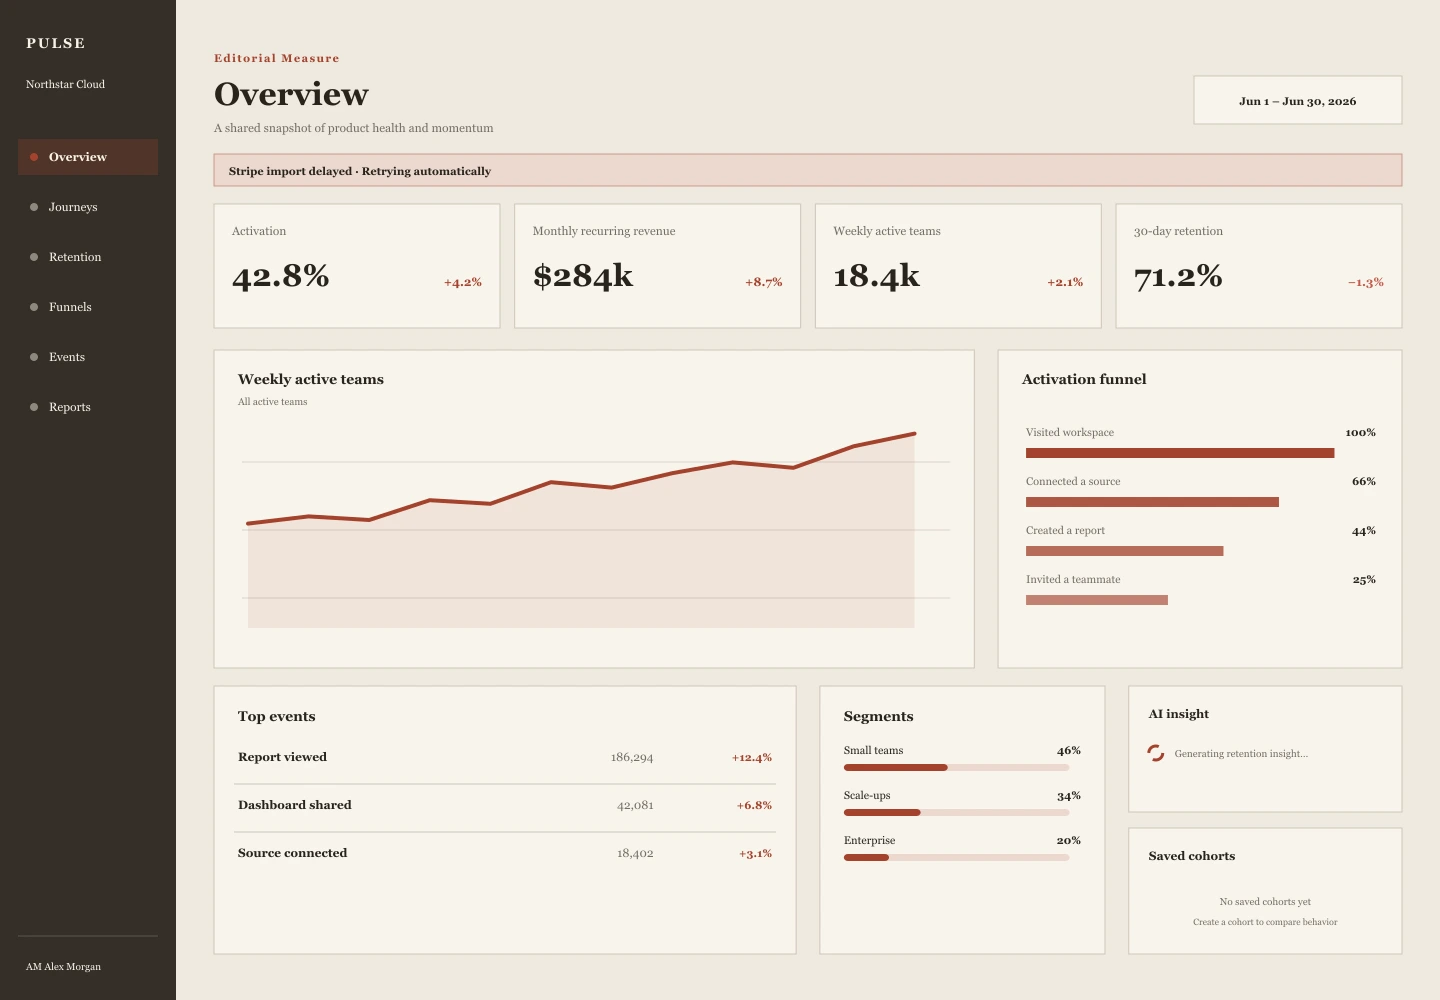
A report-like interpretation that turns product metrics into a composed editorial reading experience.
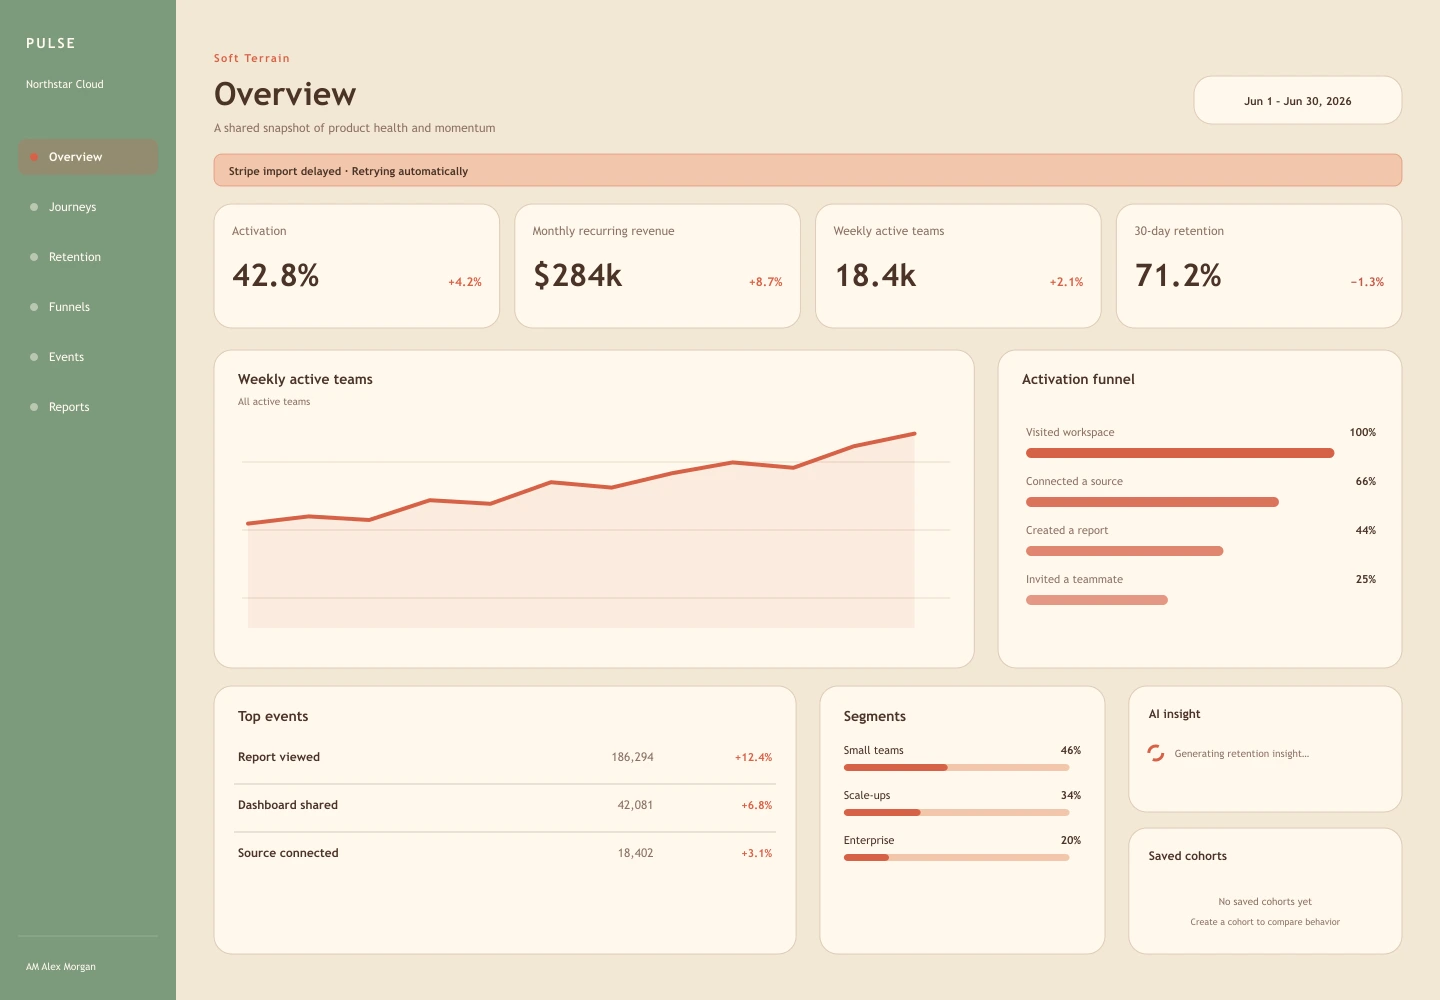
An earthy, approachable workspace that softens analytical complexity without becoming childish.
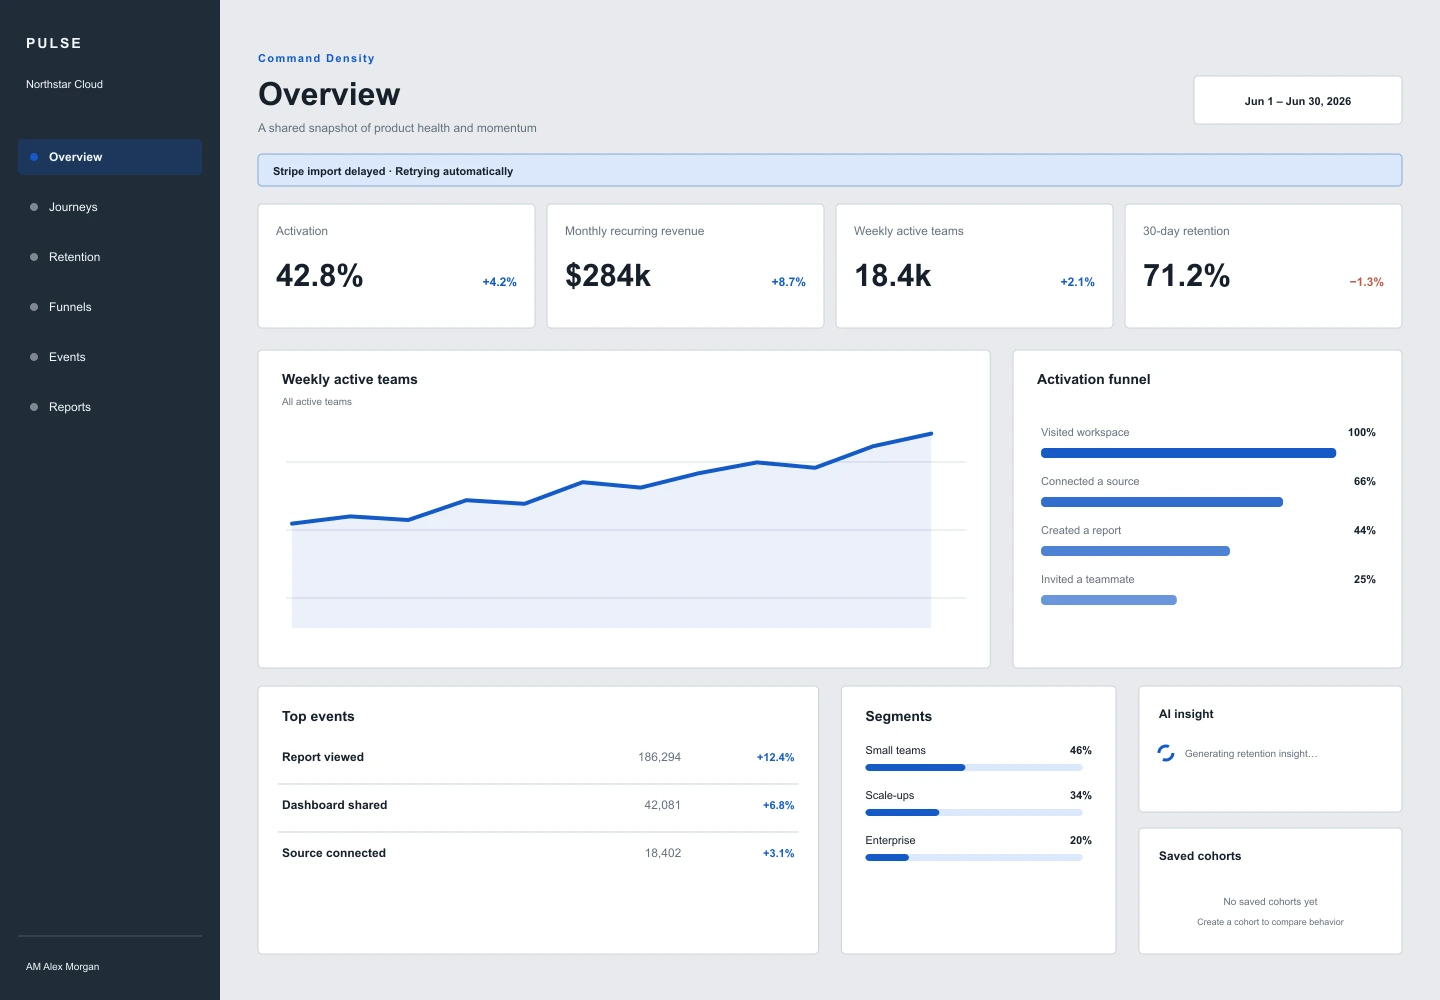
An information-dense enterprise treatment optimized for repeated scanning and operational familiarity.
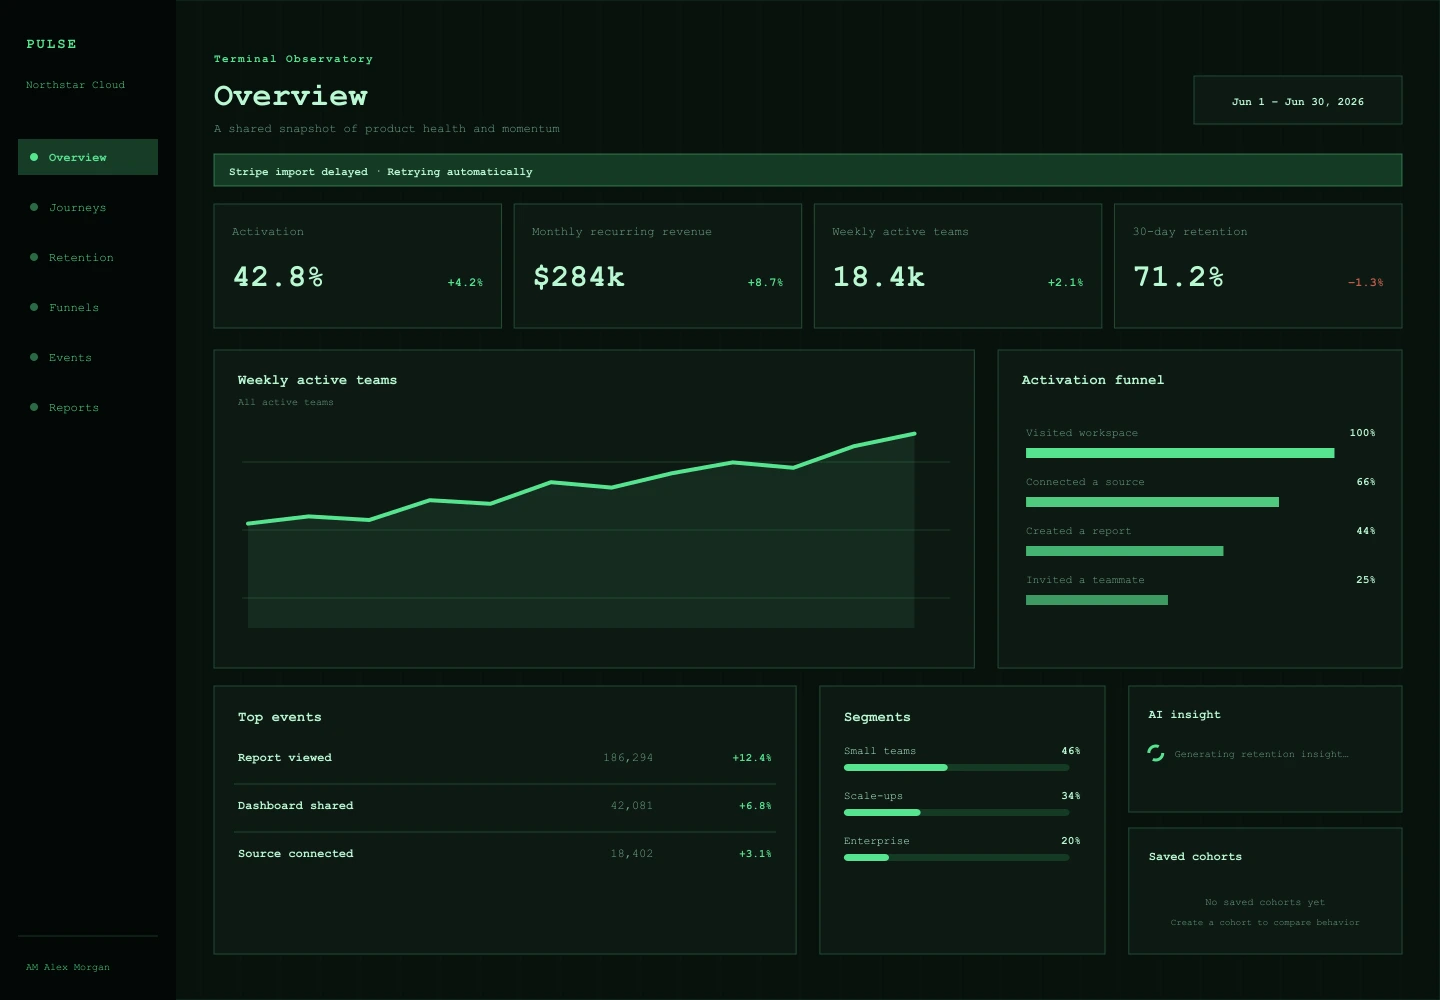
A terminal-influenced observability surface built around precise alignment, green phosphor signals, and visible structure.
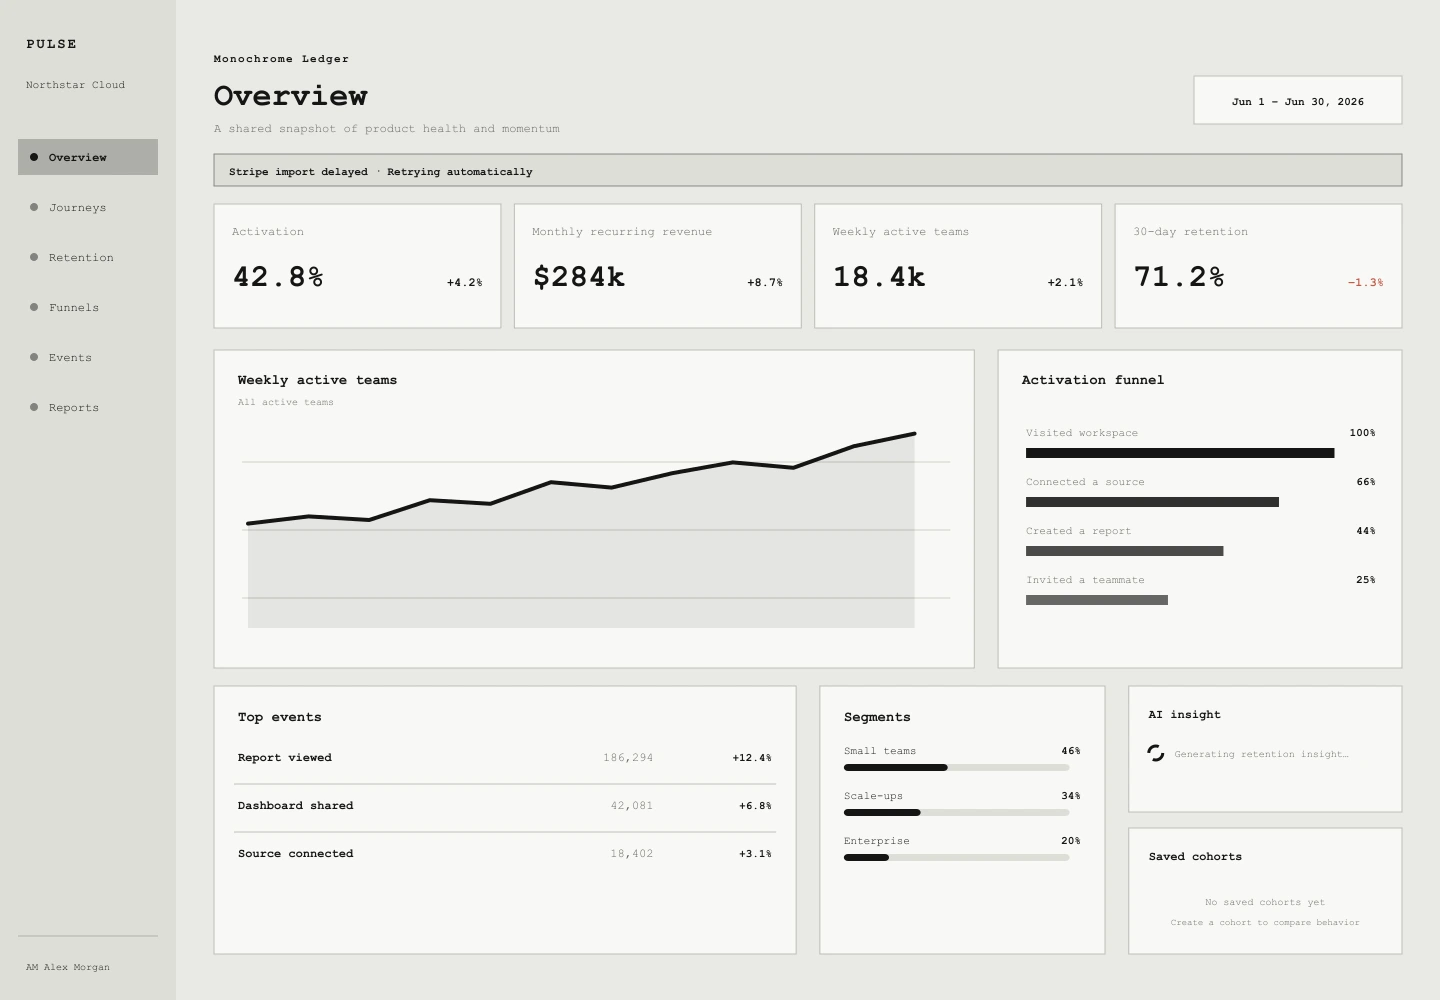
A colorless analytical ledger that asks typography, spacing, and line weight to carry the entire hierarchy.
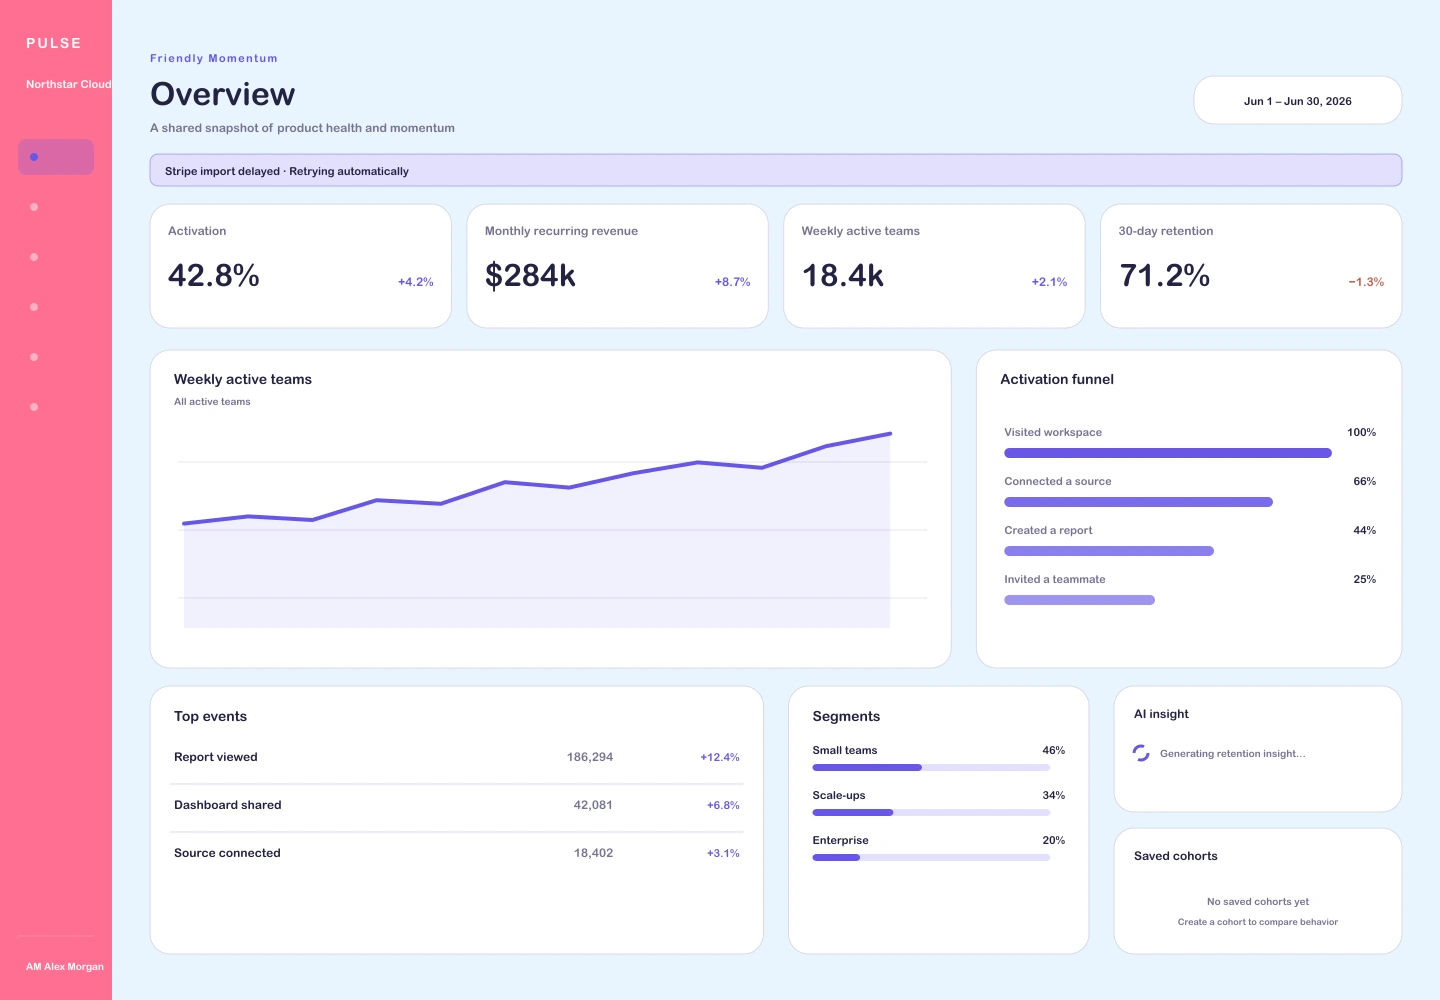
A colorful product-led interpretation designed to make first-time analytics users feel capable quickly.
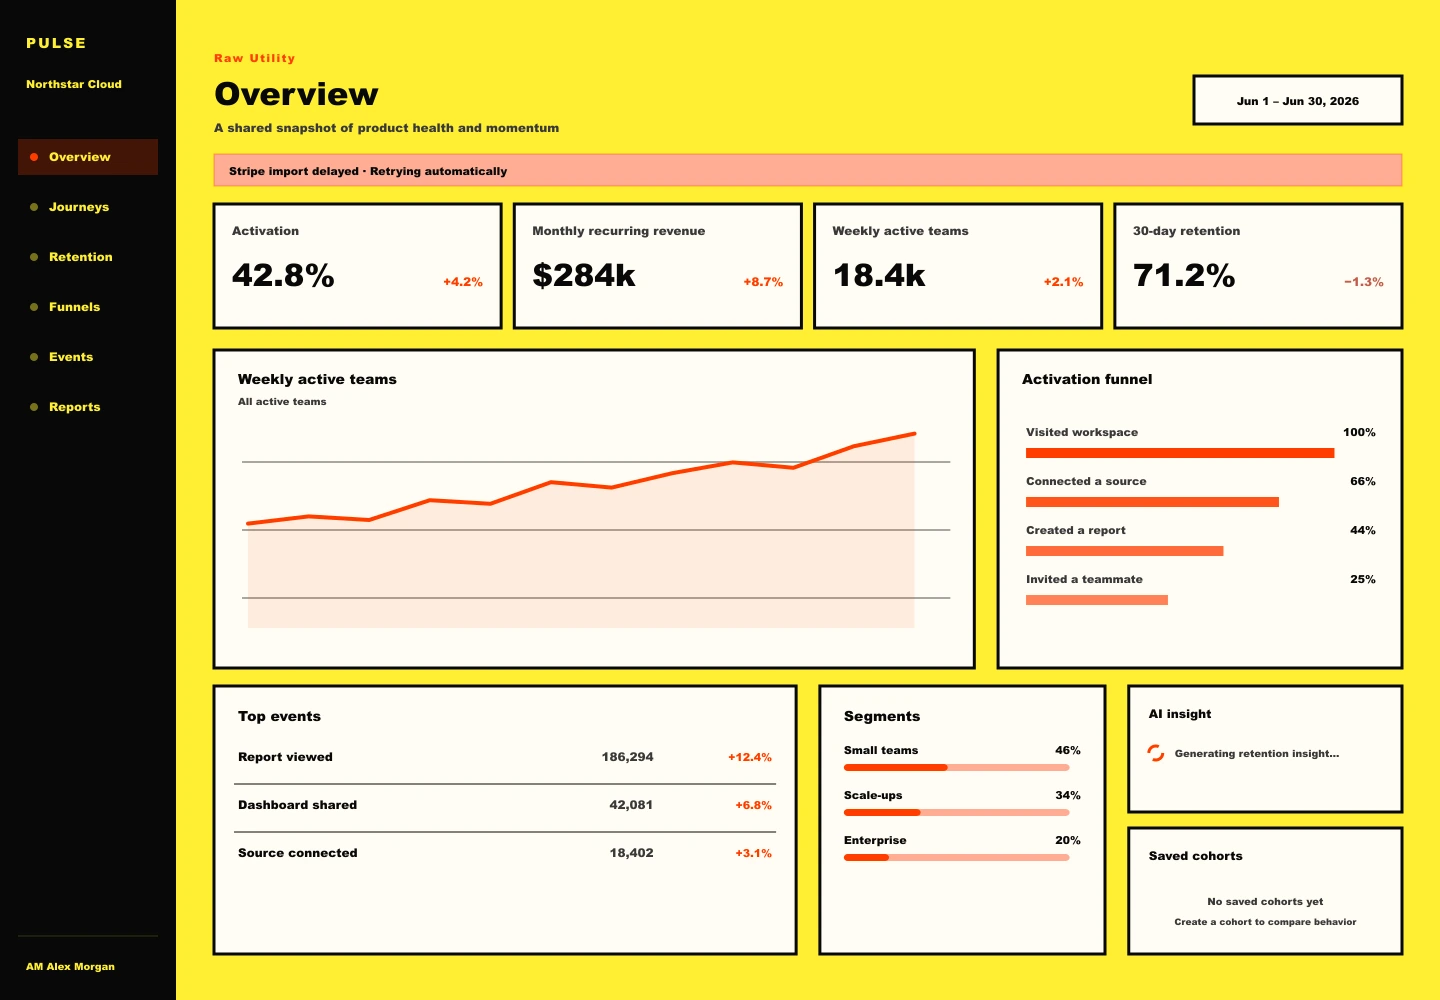
A deliberately blunt interface that turns every panel and action into an unmistakable object.
About the study
Every study contains the same metrics, warning, trend, funnel, events, segments, loading insight, and empty cohort state. Only the visual treatment changes.
This controlled setup makes the archive useful as a design reference: you can compare the decisions themselves instead of comparing unrelated products.