Curated reference · GitHub · Finance
OpenTerminal Chart Workstation
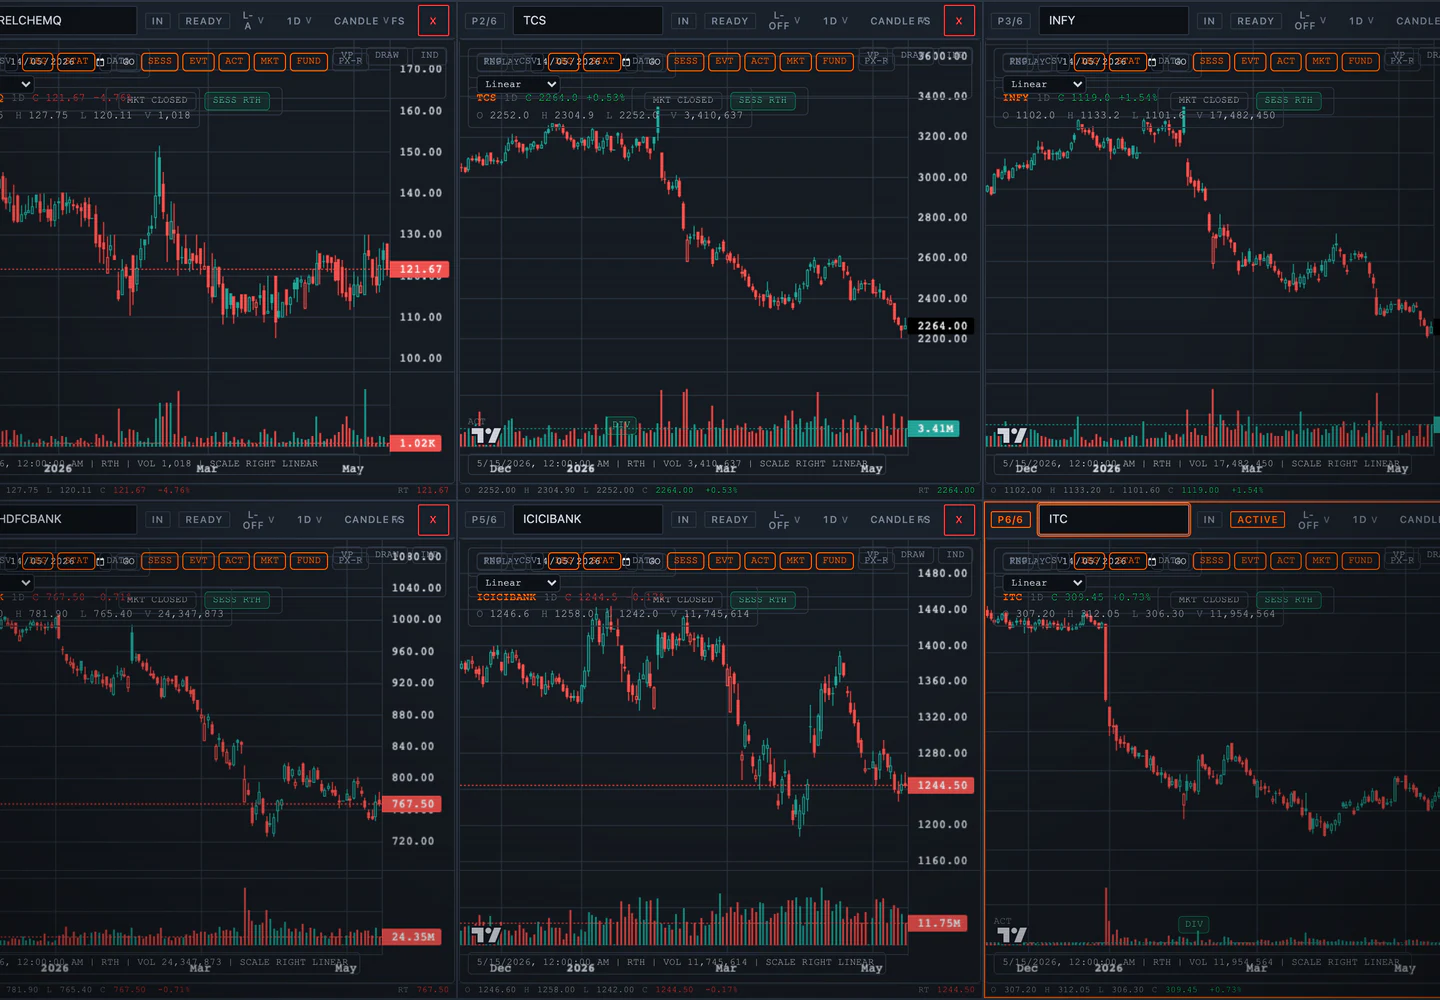
Six synchronized market charts fill the screen with almost no nonessential interface: a true working surface for comparative price action.
01 Critique
Why it works
- 01The six-panel matrix makes cross-market comparison the primary task instead of a secondary tab.
- 02Shared dark chrome and repeated axes reduce the cognitive cost of moving between instruments.
- 03Orange, red, and green are reserved for market state and controls rather than decorative branding.
02A Advantages
Strengths
- Exceptional information density
- Clear professional purpose
- Strong multi-panel consistency
02B Constraints
Trade-offs
- Steep learning curve
- Small annotations demand large displays
03 Contribution
Why it belongs in the archive
Commits nearly the entire viewport to synchronized evidence instead of summary cards.