Internal concept study · Product Analytics
Spectrum Atlas
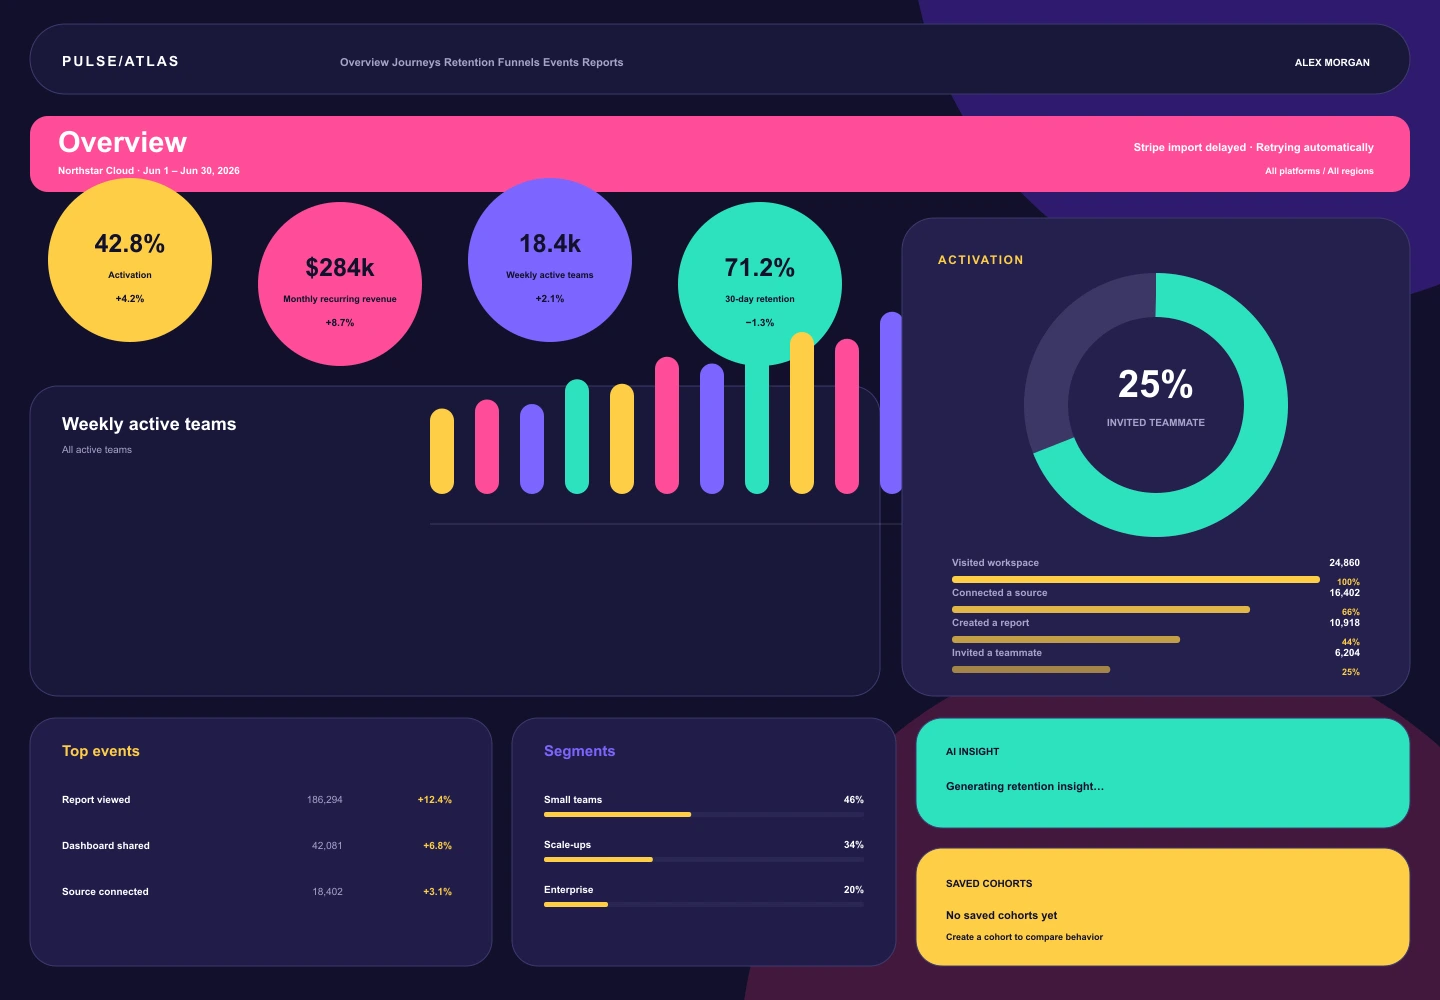
A data-viz maximalist study turns each performance signal into a vivid, individually recognizable object.
01 Critique
Why it works
- 01Color families give each metric an identity that persists across the composition.
- 02Circular and bar forms create productive contrast between summary and movement.
- 03Large shapes keep the energetic system readable at a glance.
02A Advantages
Strengths
- Immediate visual impact
- Strong metric recall
- Varied visualization vocabulary
02B Constraints
Trade-offs
- Many colors demand disciplined semantic governance
- The expressive composition may distract during detailed analysis
03 Contribution
Why it belongs in the archive
Treats data visualization as the primary brand expression while retaining a complete operational workspace.