Internal concept study · Product Analytics
Node Network
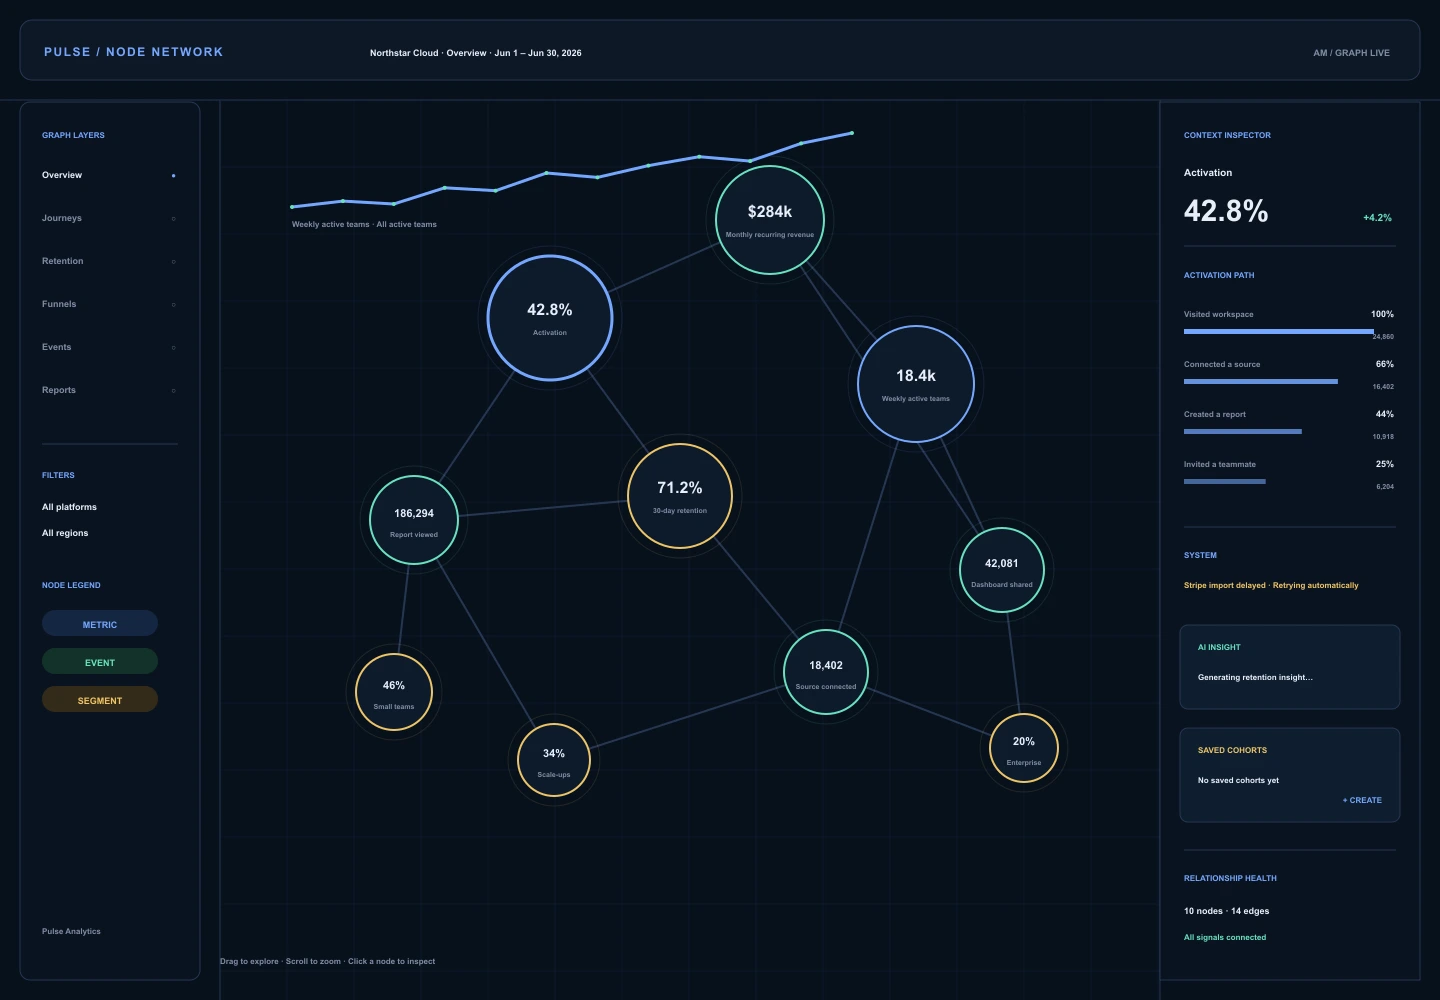
A relationship canvas models metrics, events, segments, and conversion stages as an explorable network of connected evidence.
01 Critique
Why it works
- 01Edges make dependencies visible where dashboard grids normally imply none.
- 02Node size and halo states communicate importance and current attention.
- 03A compact inspector gives exact values without breaking the exploratory canvas.
02A Advantages
Strengths
- Reveals hidden relationships
- Powerful exploratory model
- Distinct overview-to-detail transition
02B Constraints
Trade-offs
- Graph layouts can become unstable at scale
- Exact comparisons are slower than in tables
03 Contribution
Why it belongs in the archive
Elevates relationship structure into the primary analytical interface while retaining exact dashboard measures in context.