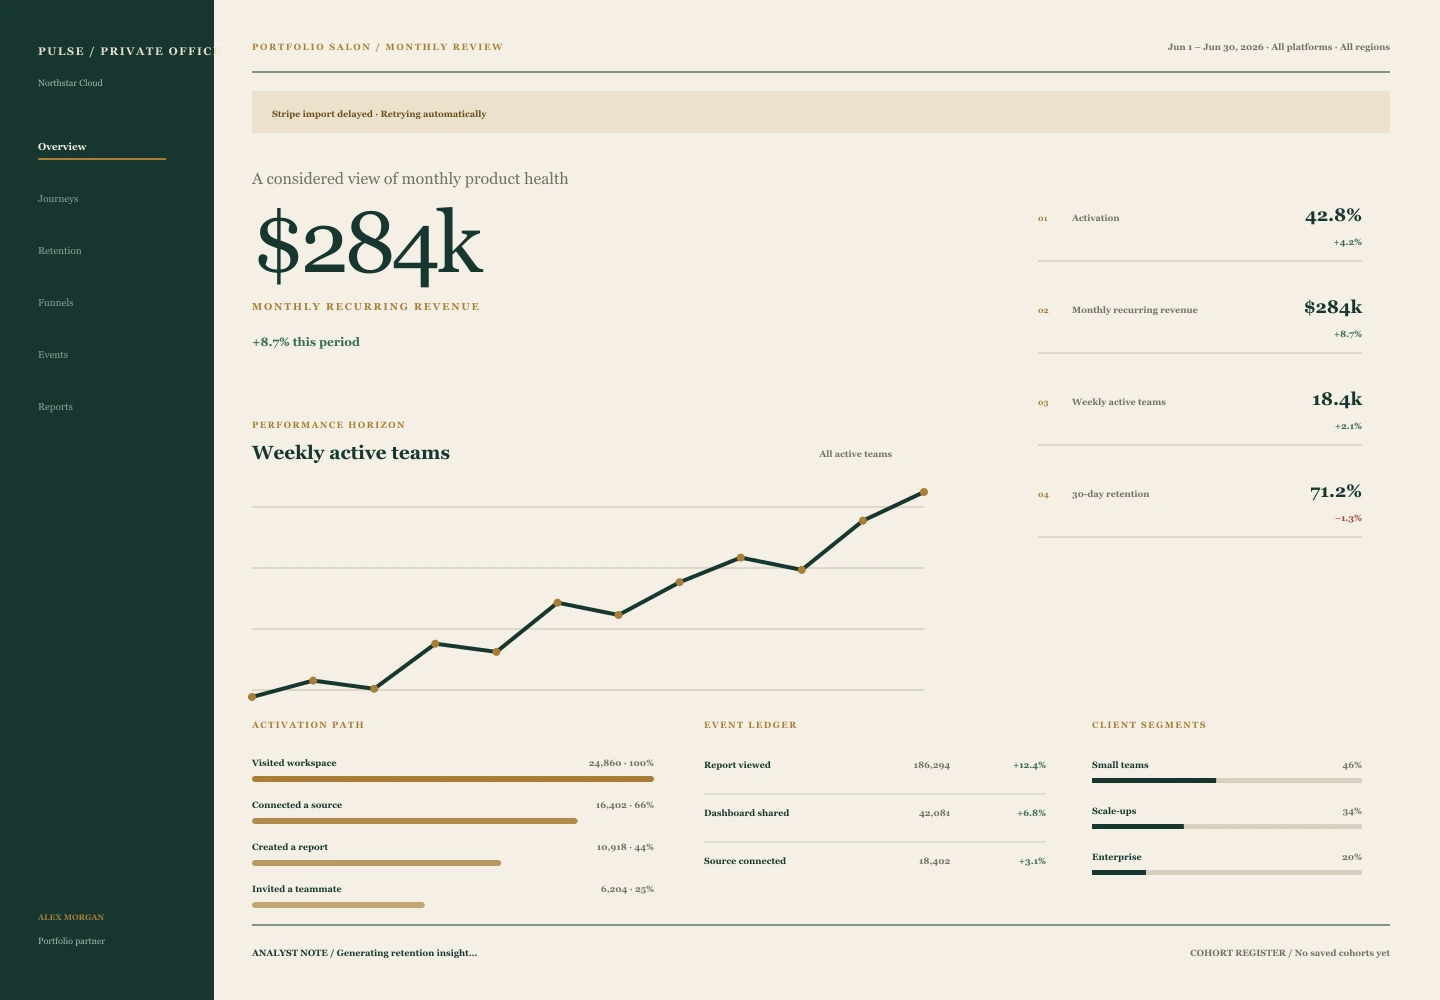
Portfolio Salon
A private-bank calm gives product performance the cadence of a considered portfolio review.
One dataset · 70 visual systems
Index 01 · Comparative interface archive
70 visual systems applied to one product analytics workspace. The data never moves; the design decisions do.
Compare what each system makes immediate, what it pushes aside, and how the same evidence changes character through hierarchy, density, typography, and color.
All studies · ordered by curator score
A private-bank calm gives product performance the cadence of a considered portfolio review.
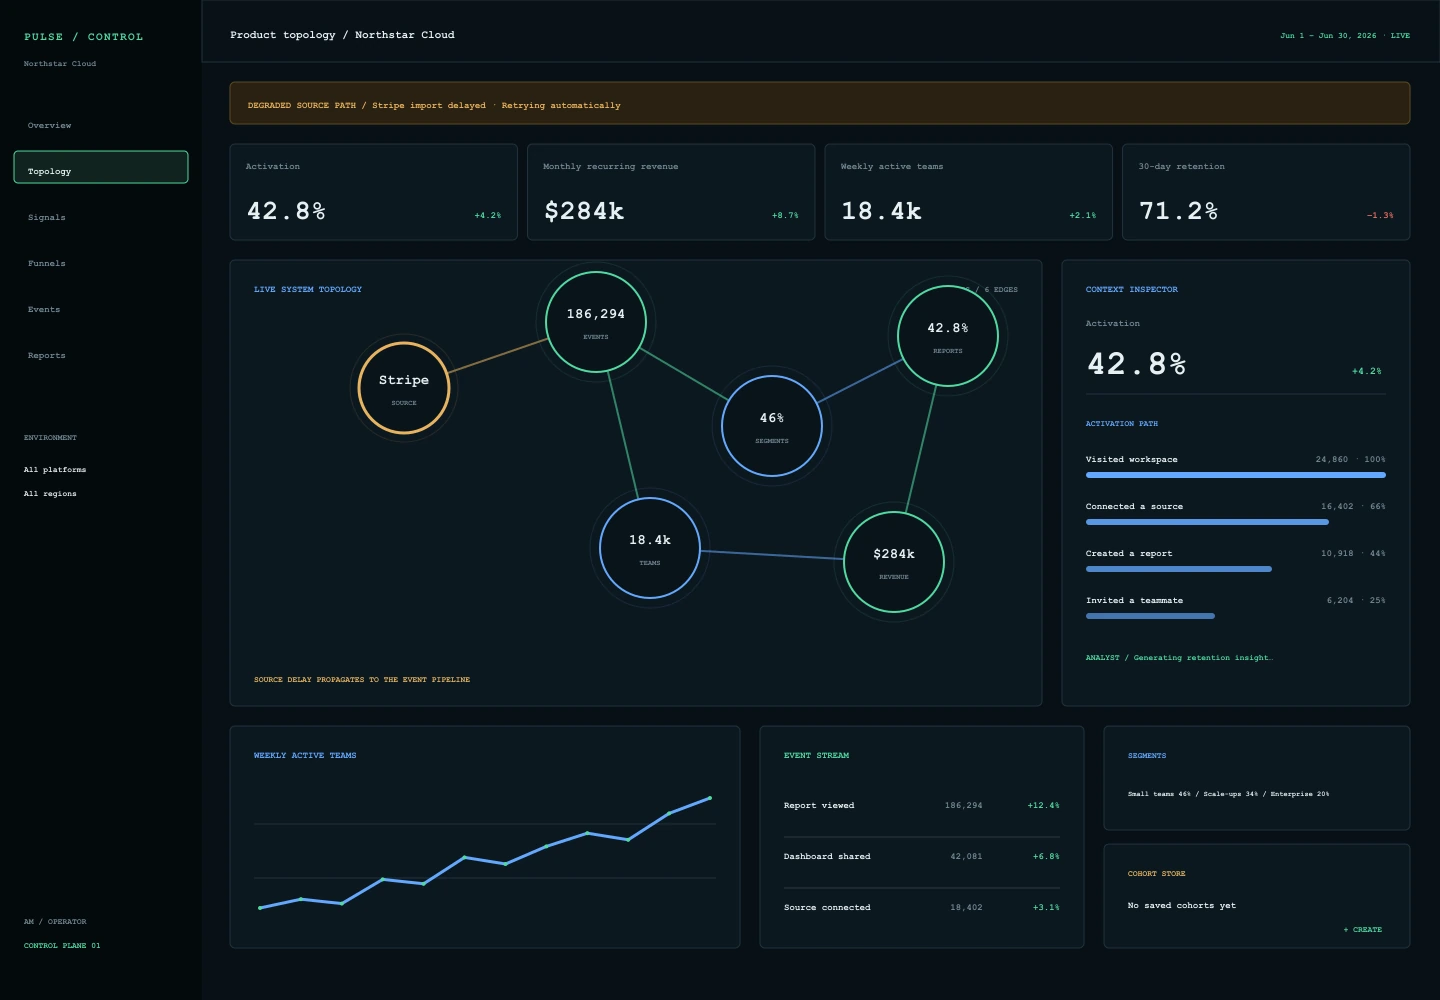
An infrastructure control plane turns the analytics workspace into a live topology of product systems and outcomes.
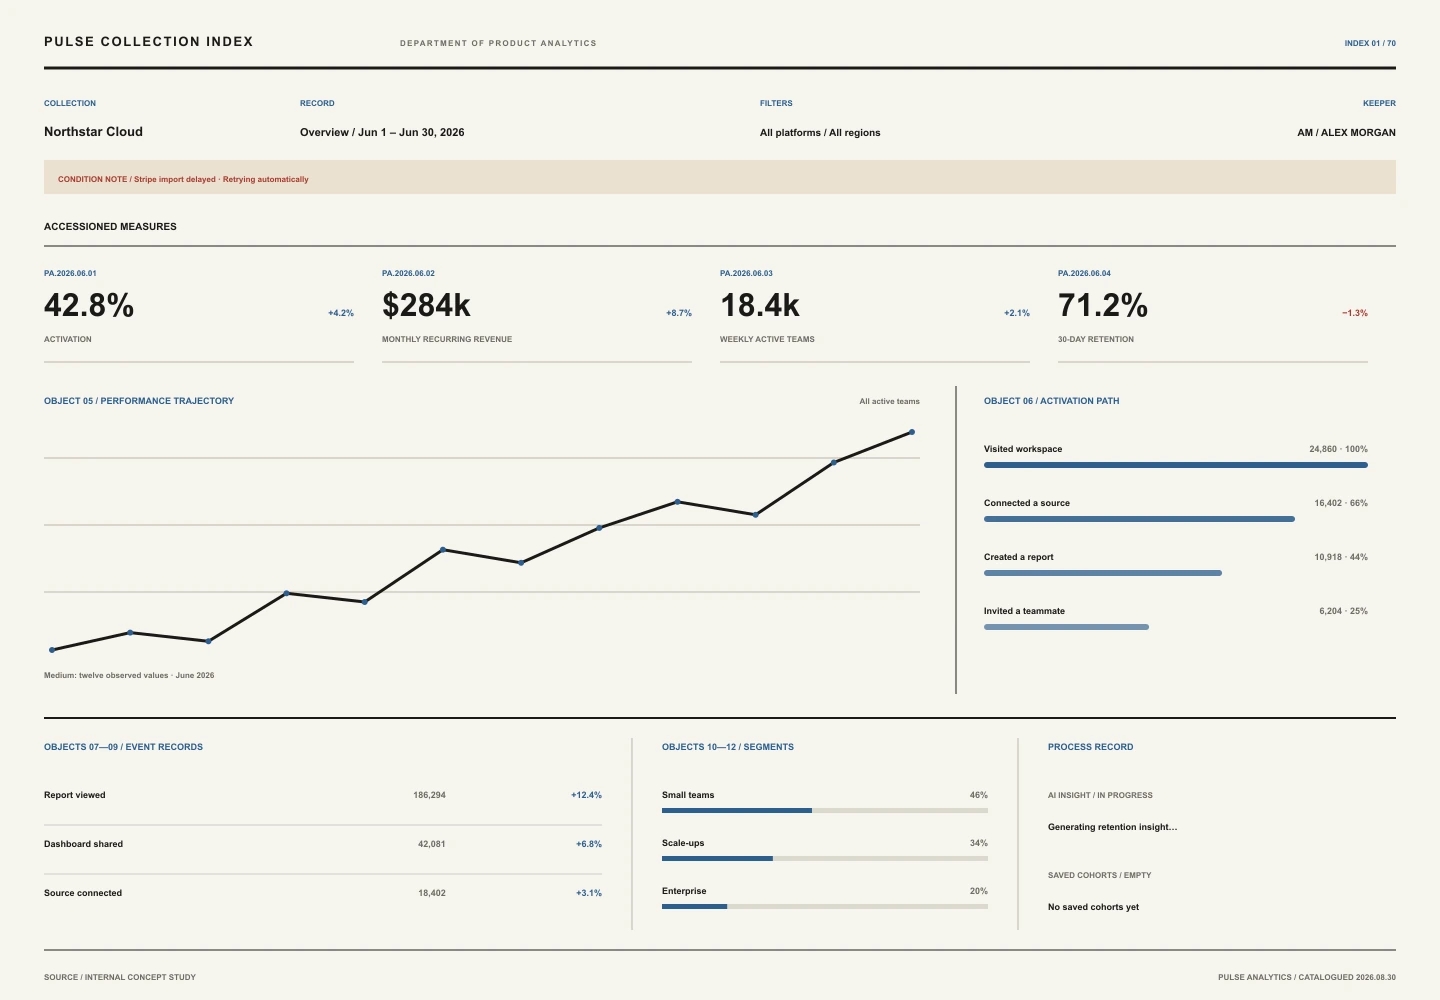
A museum collection index catalogs each analytical object with accession logic, context, and measured typographic order.
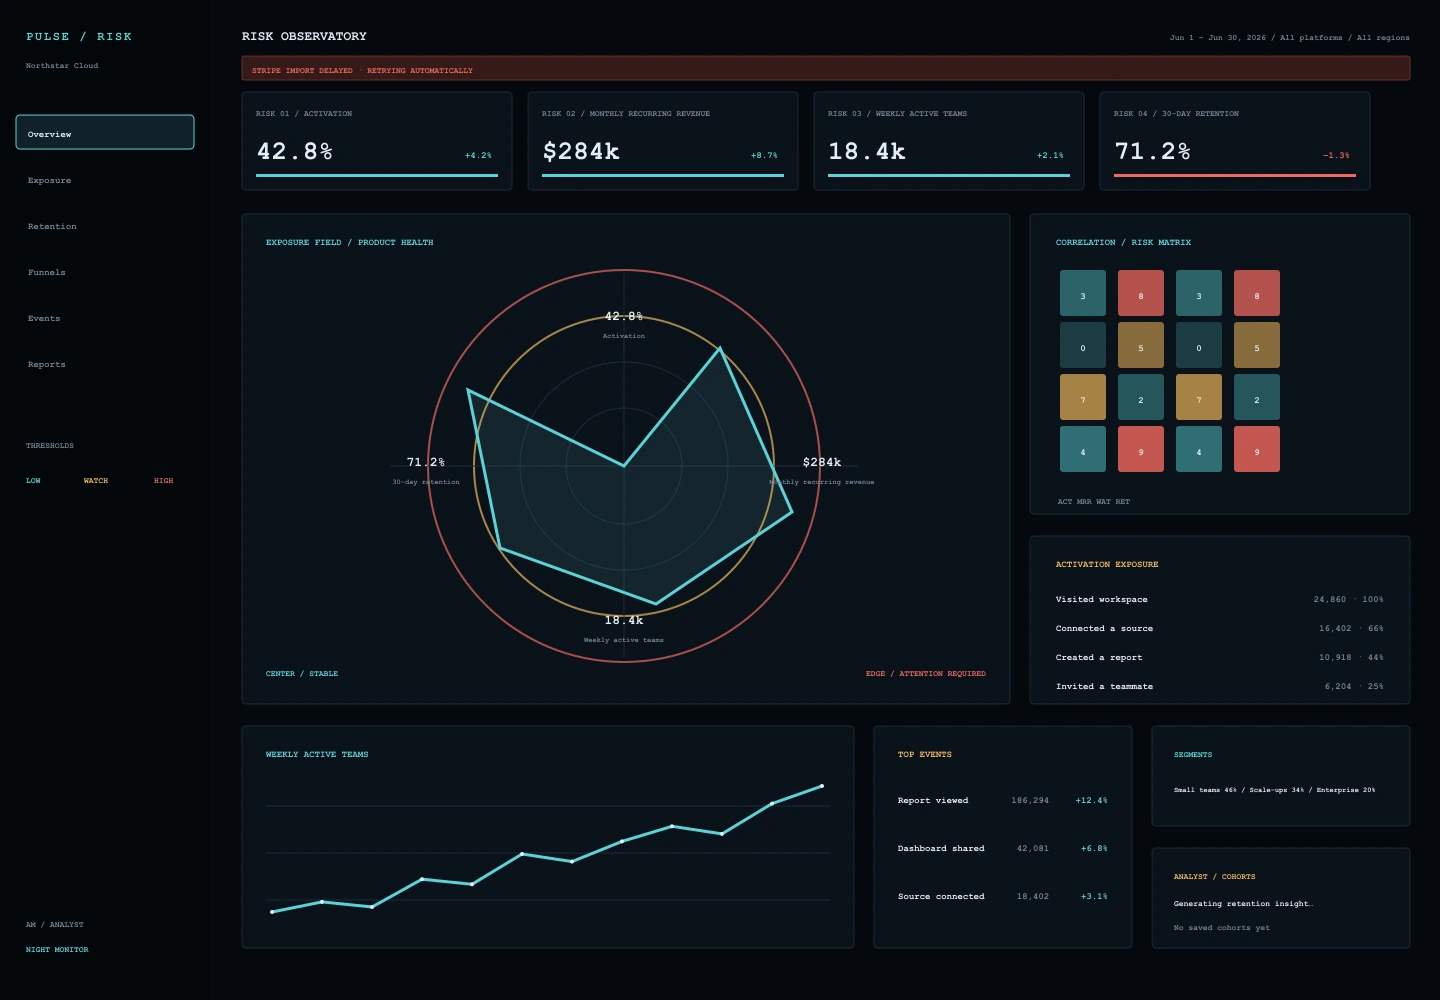
A night-shift risk room organizes growth, retention, and ingestion health around exposure and attention.
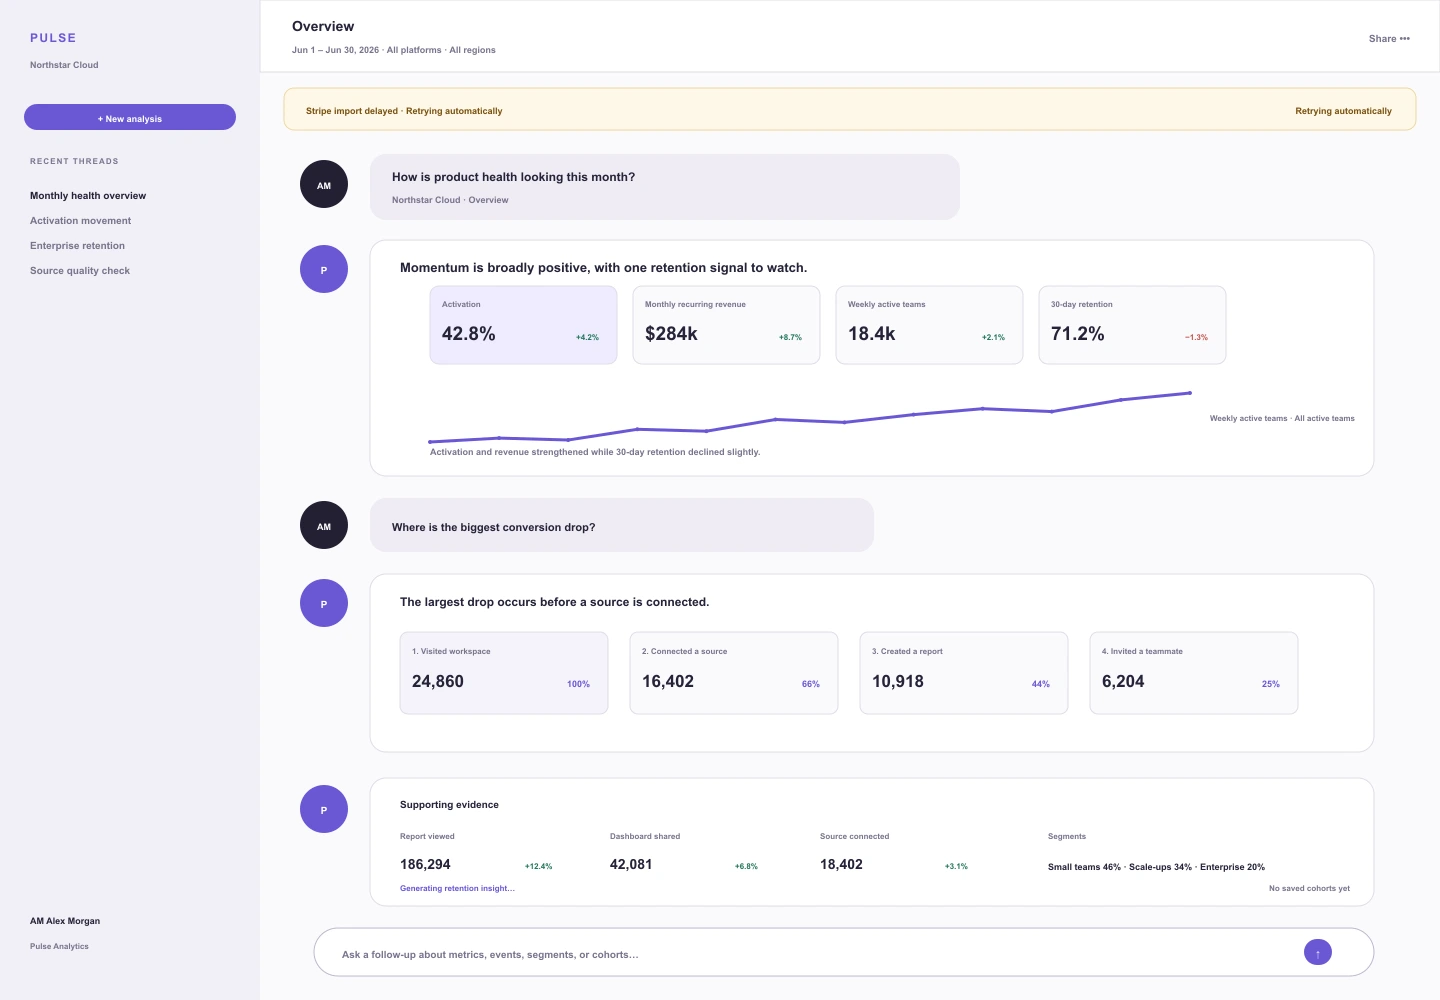
A conversation-led analysis turns the dashboard into a guided exchange where every claim is paired with compact inline evidence.
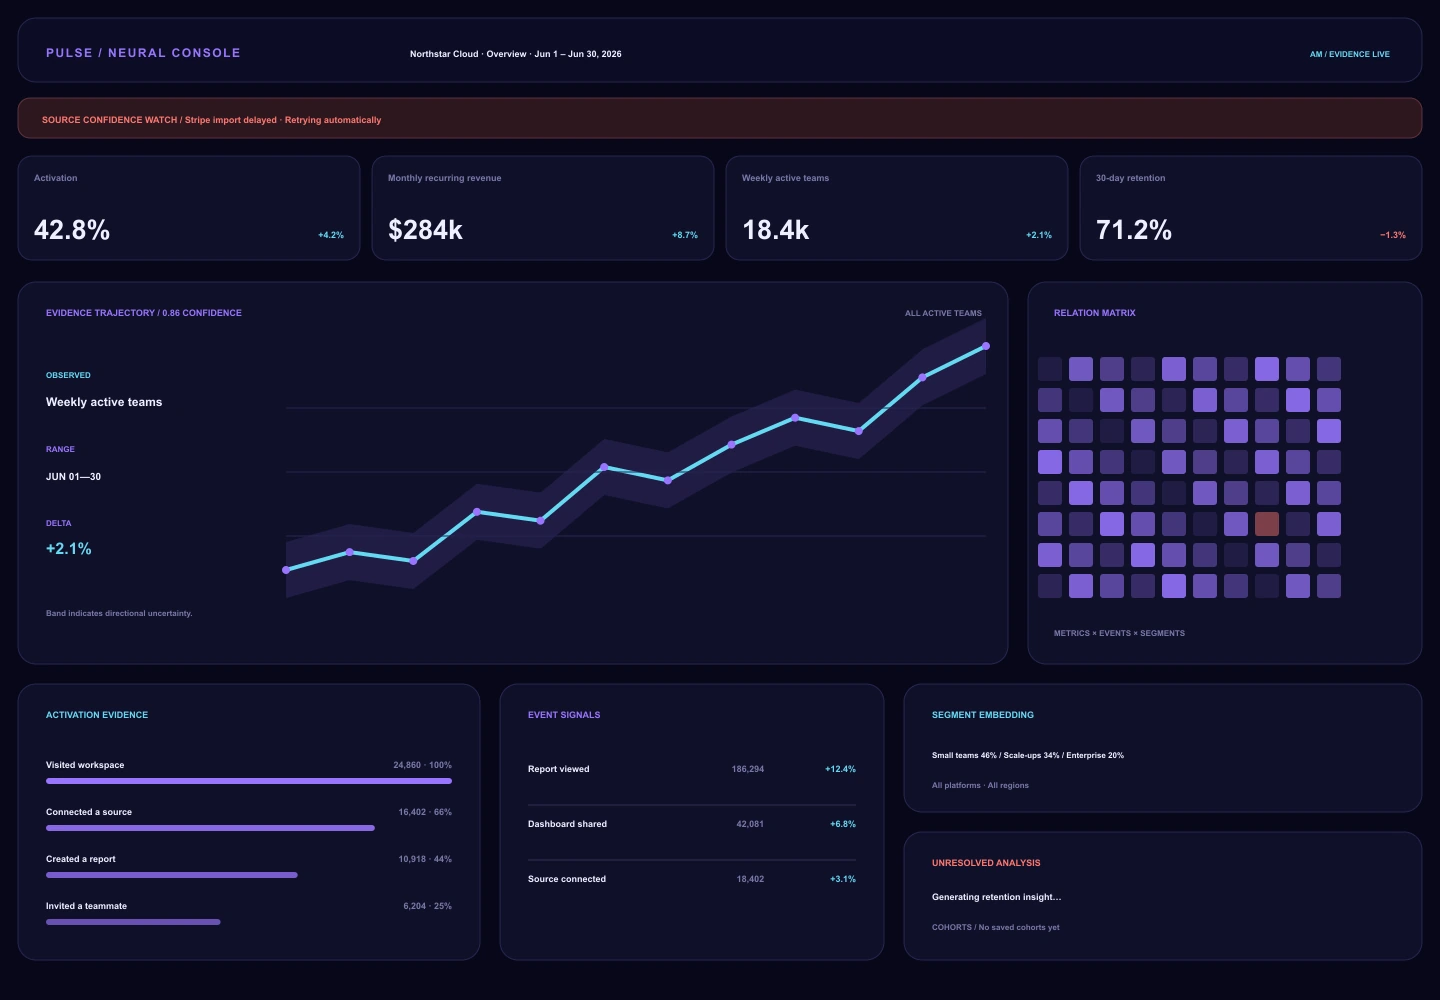
A model-evaluation console presents product signals as evidence with confidence, context, and unresolved states.
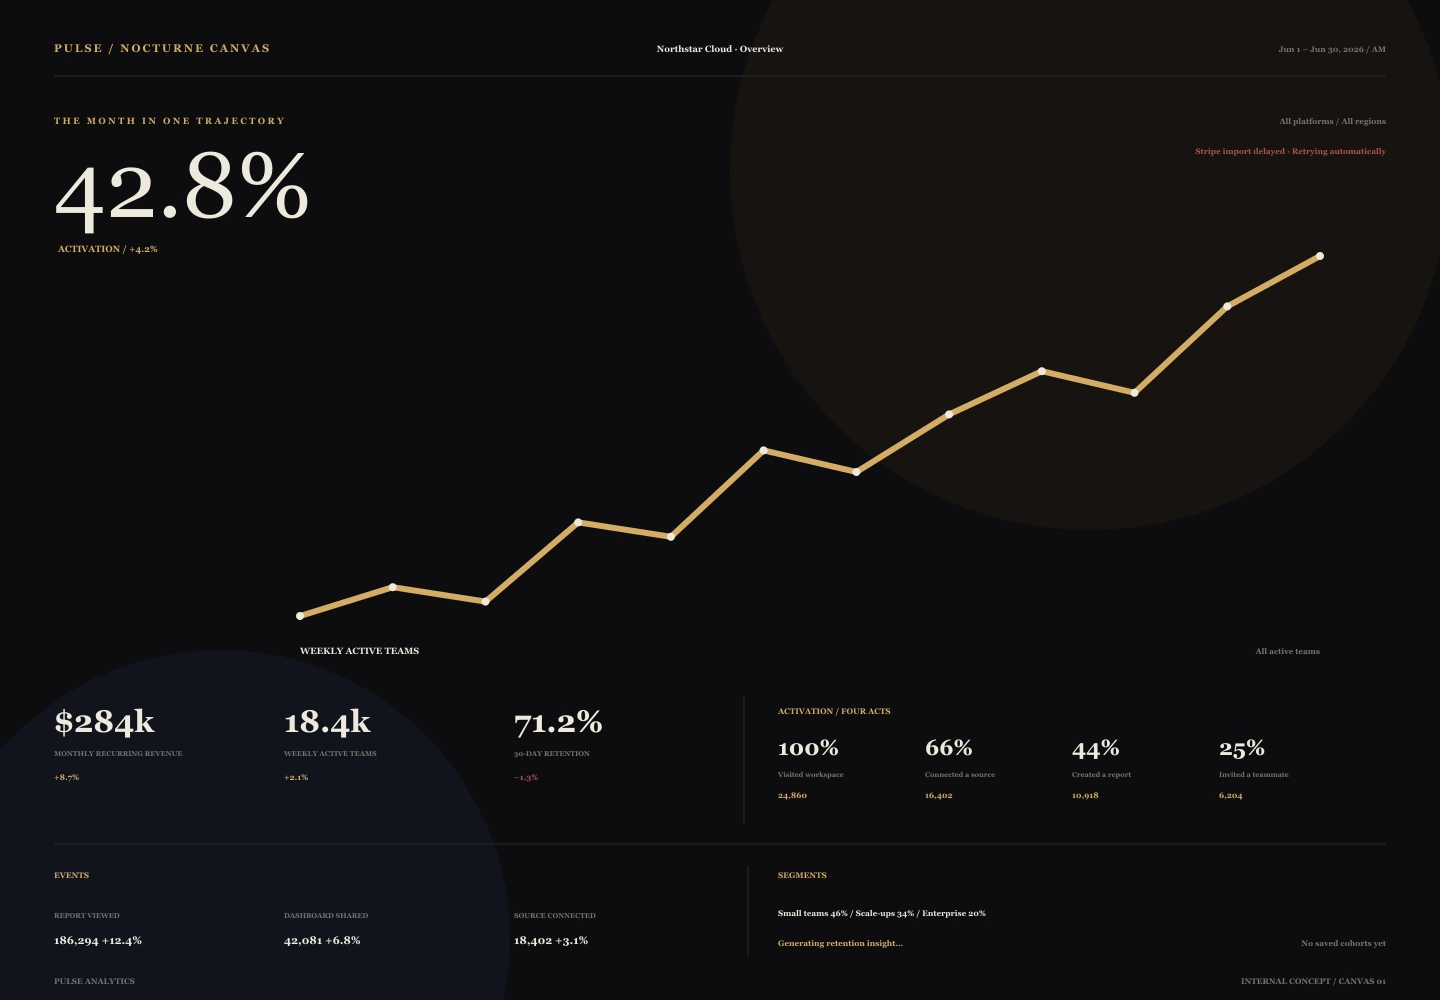
A nocturnal canvas gives one golden trajectory room to breathe while secondary evidence gathers at the edges.
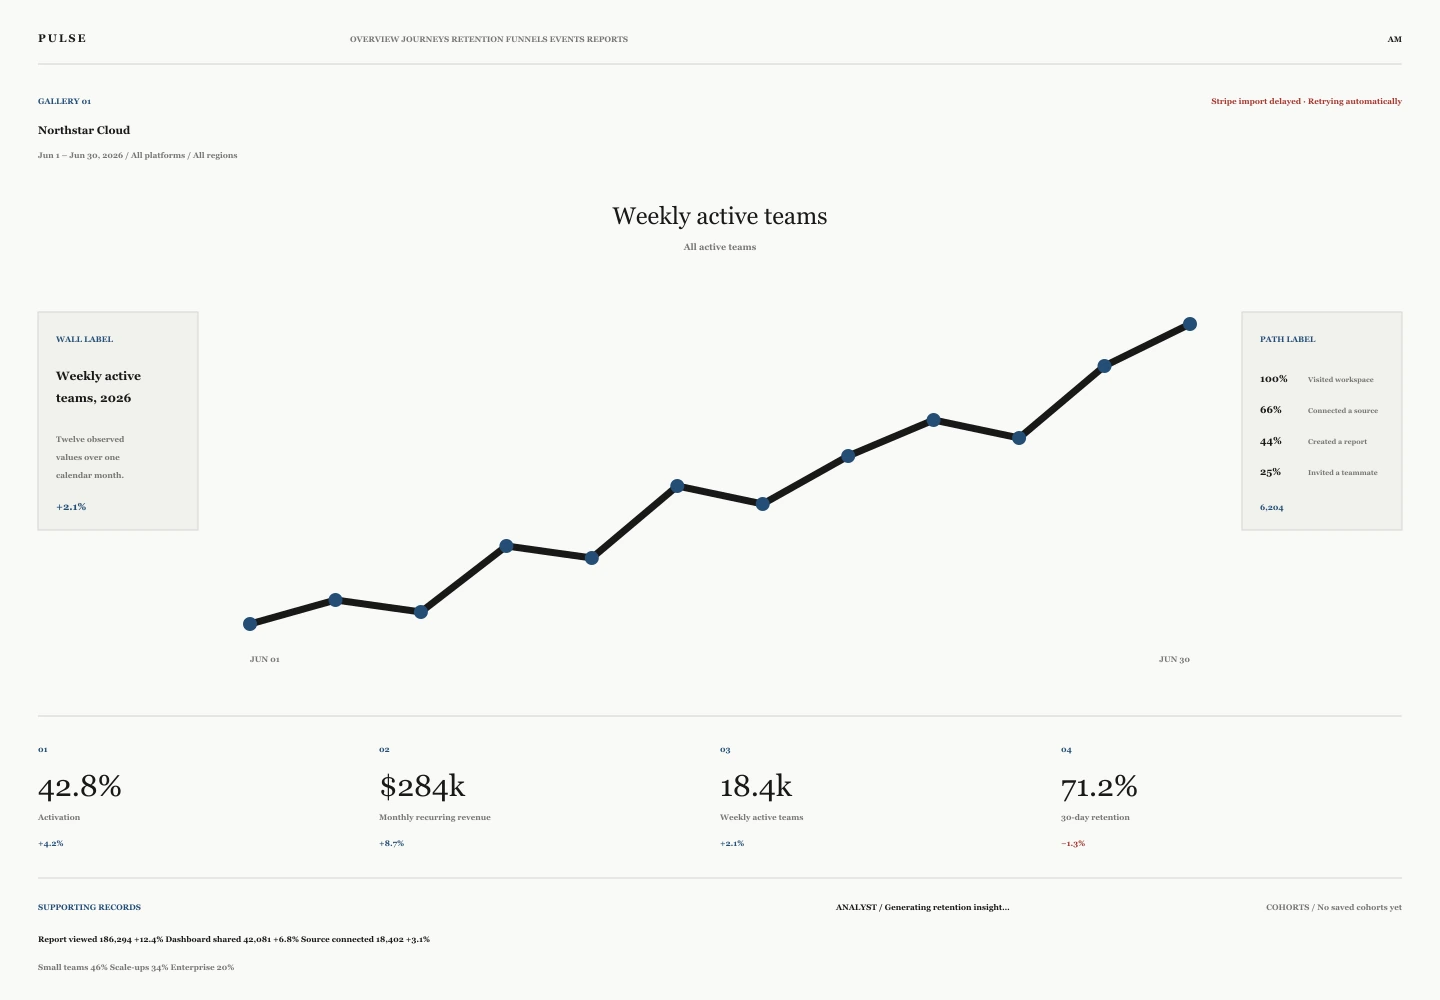
A white-cube installation isolates the main analytical object and moves supporting interpretation to the room's perimeter.
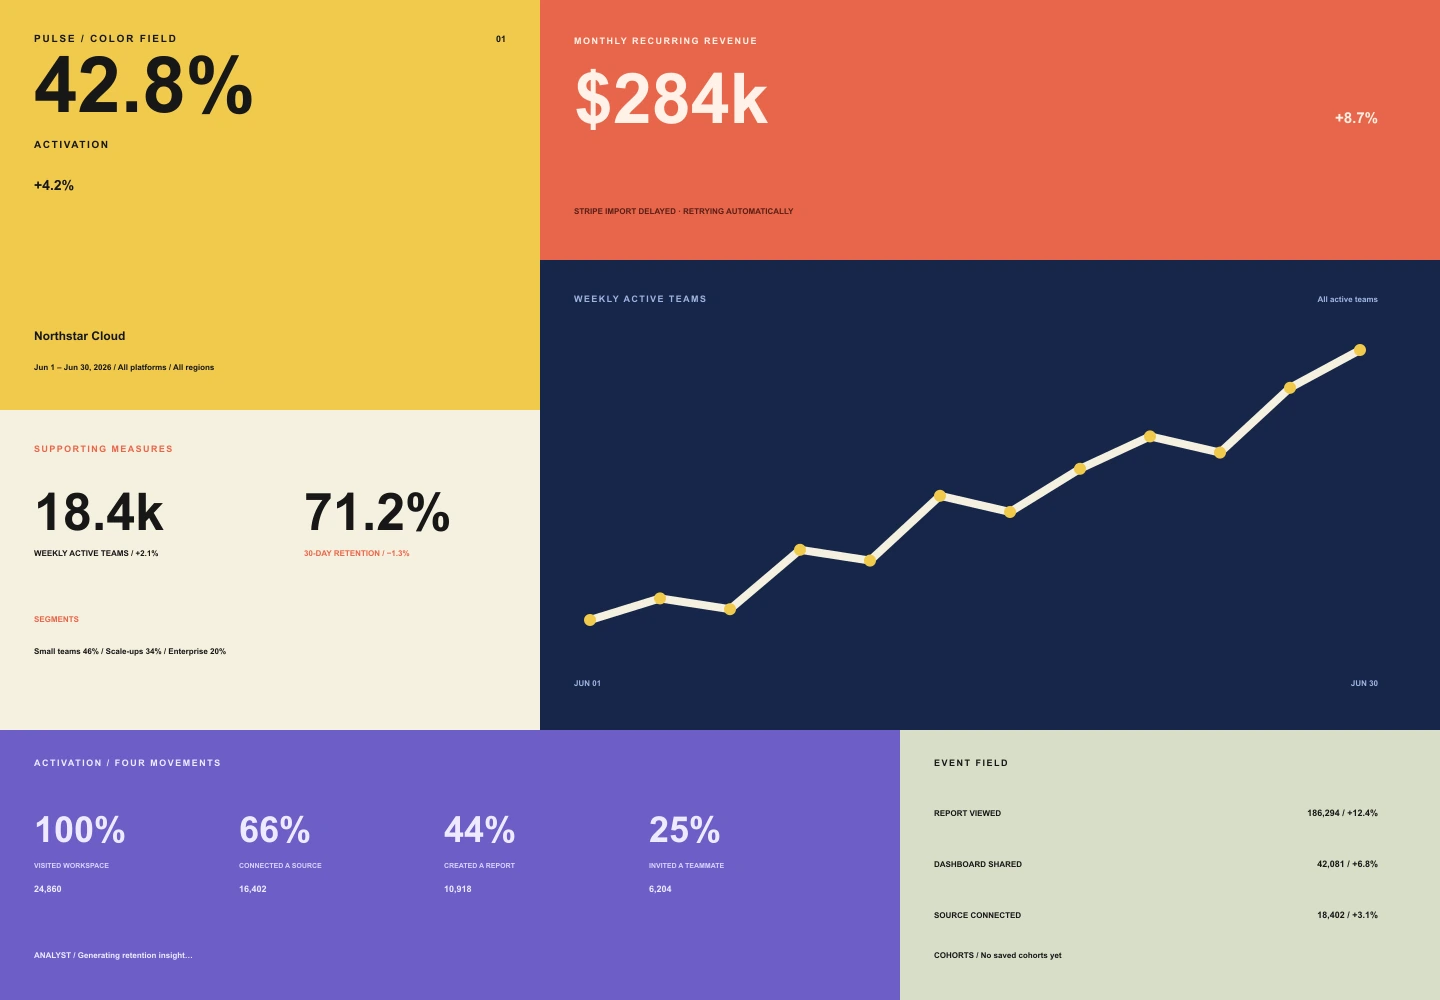
Broad fields of color turn hierarchy into spatial atmosphere while a few precise labels keep the dashboard analytical.
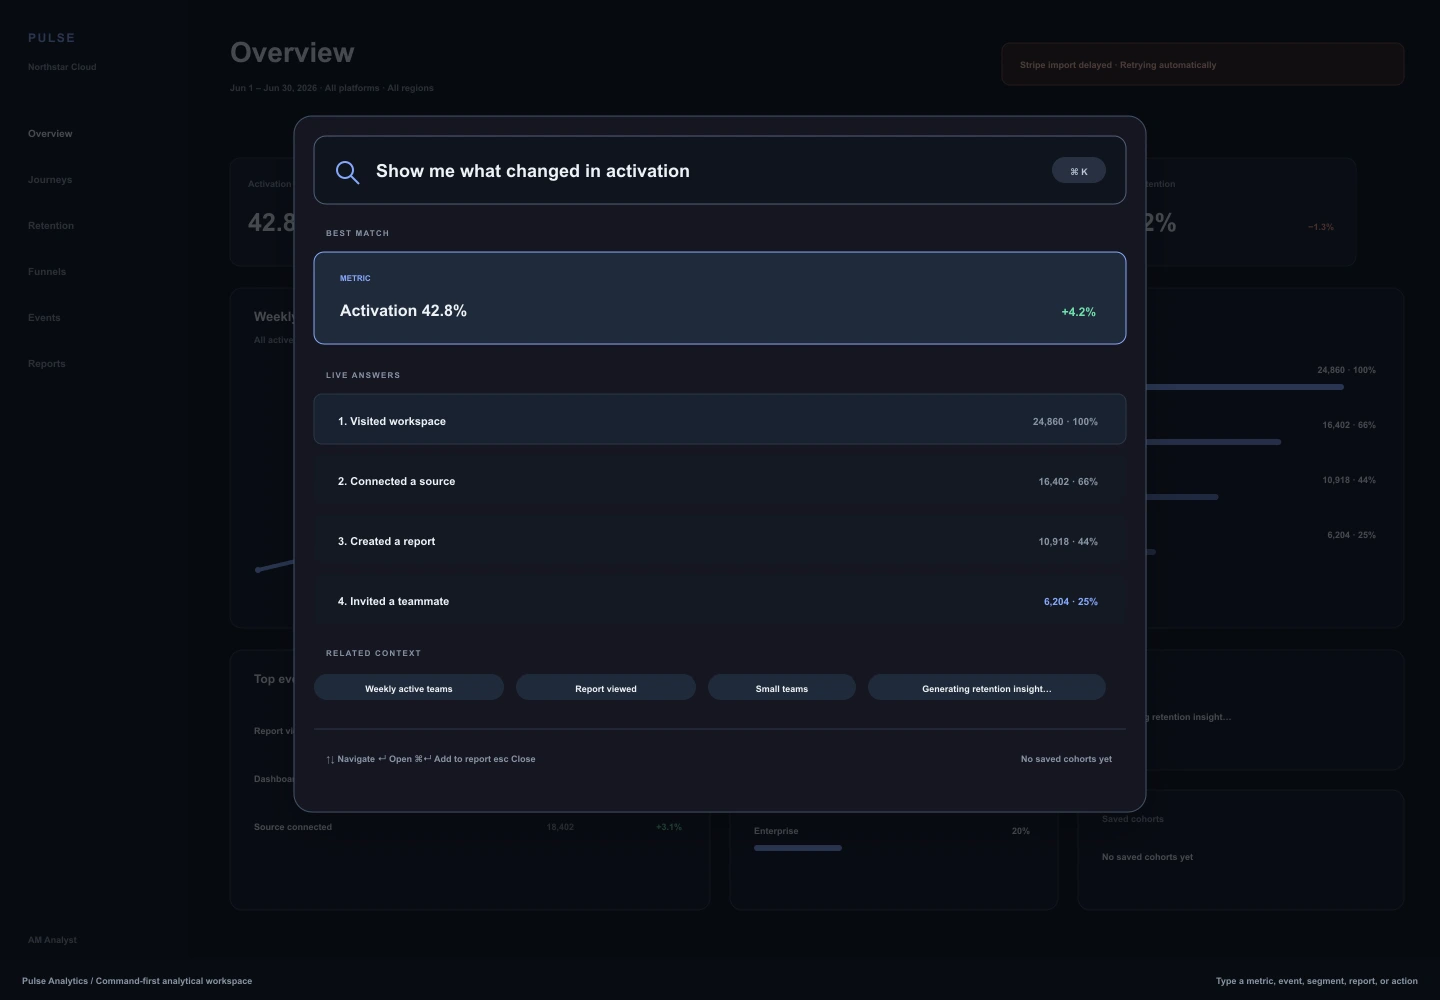
A command-first workspace makes search the primary analytical surface, with live results composing the dashboard around the question.
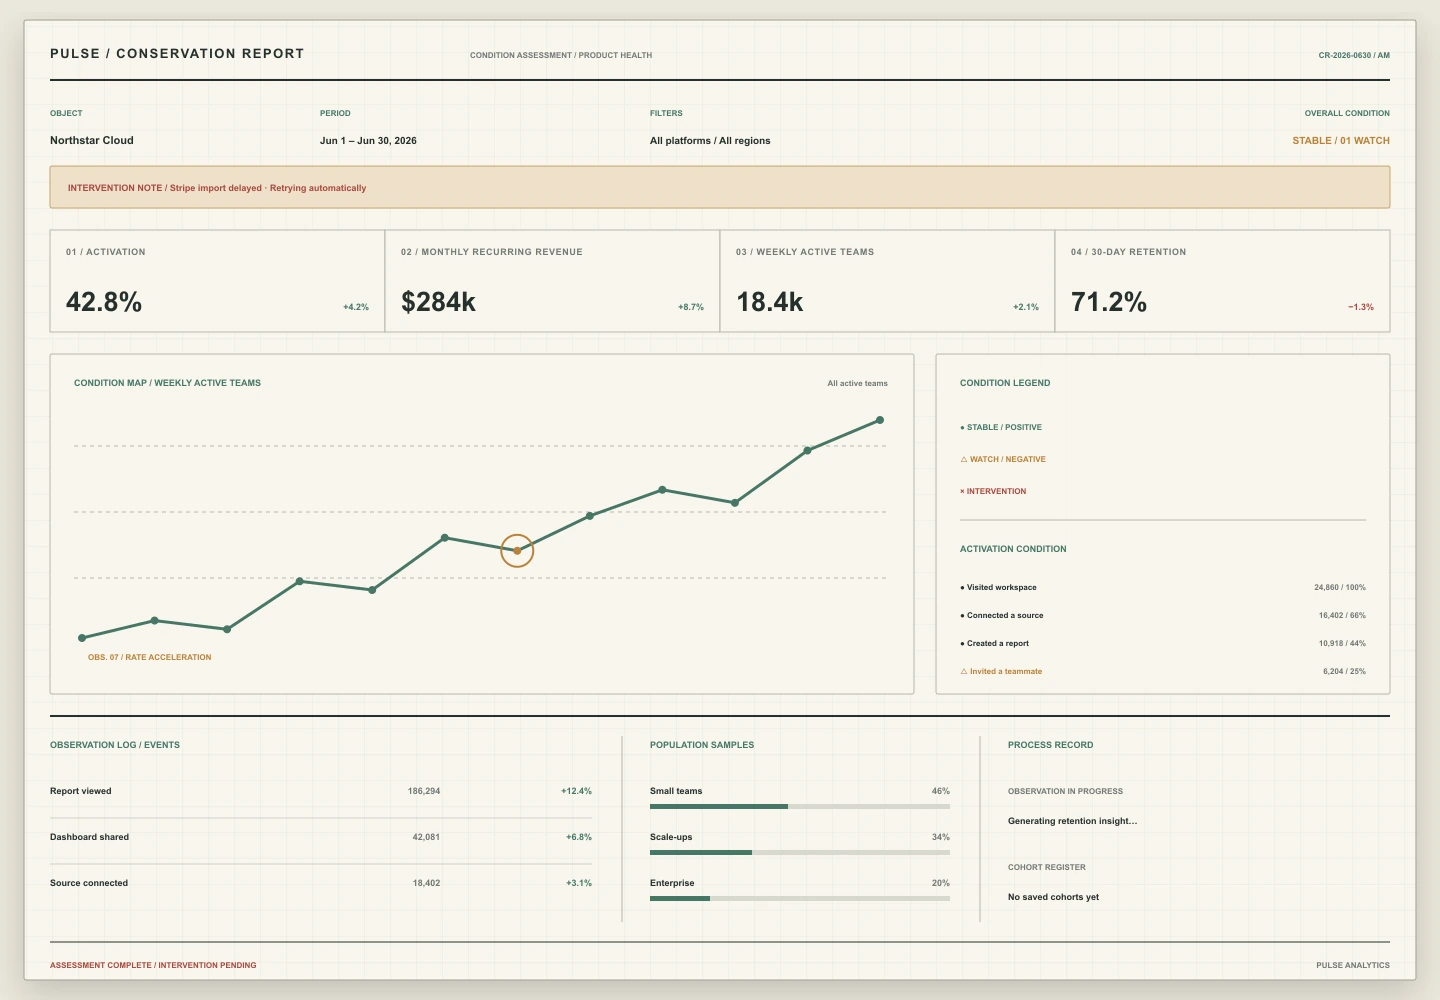
A conservation worksheet records product health through condition mapping, observations, and explicit interventions.
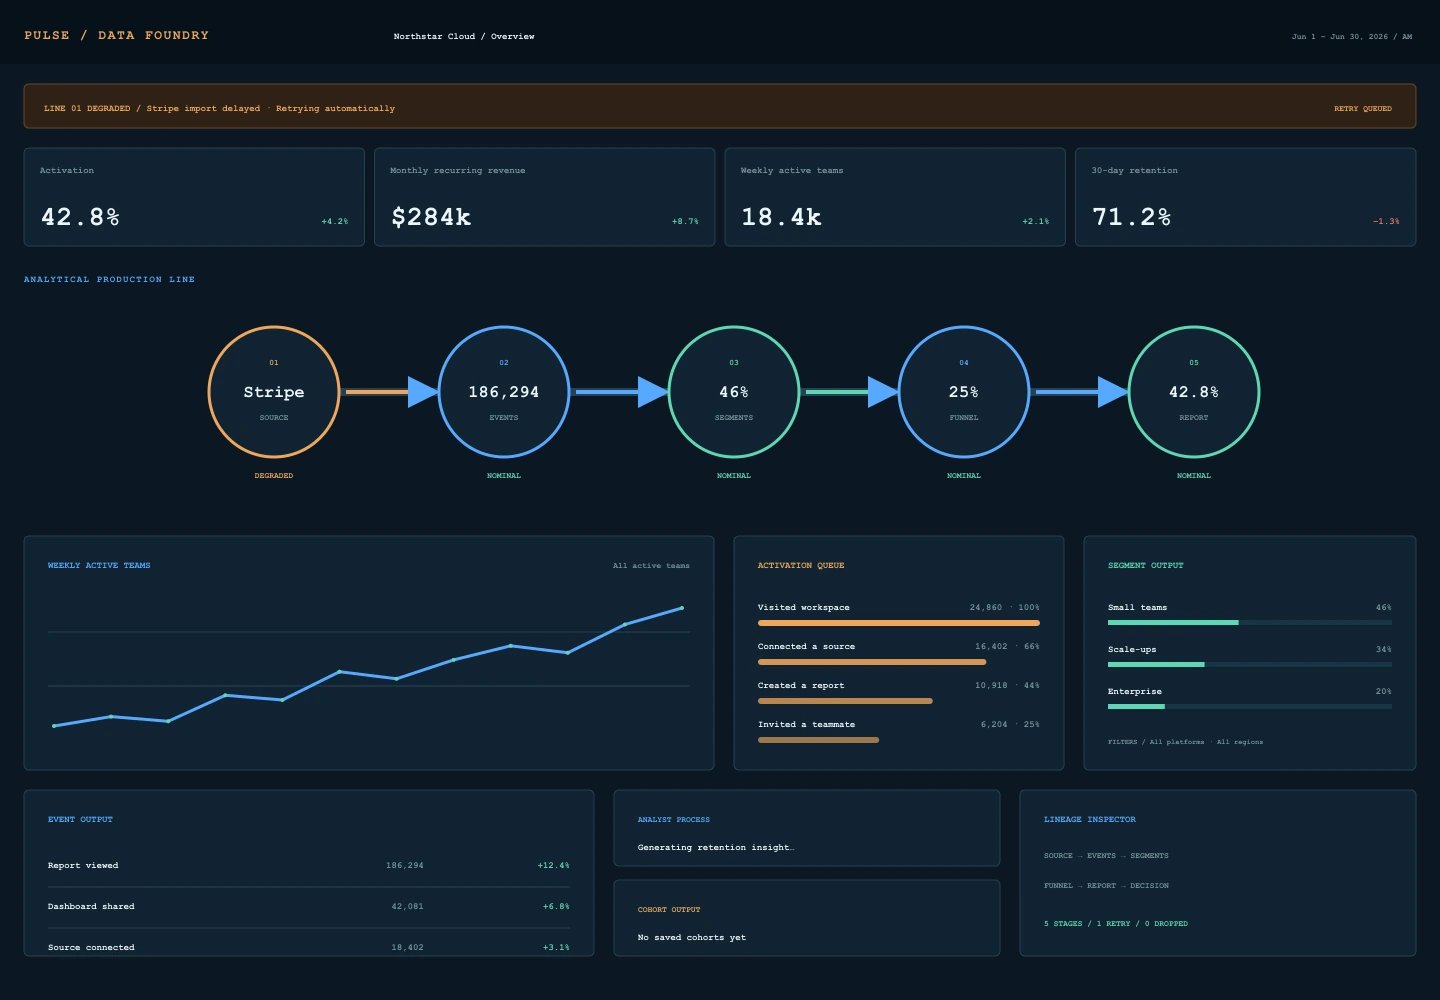
A pipeline-first workbench exposes how raw activity becomes events, segments, funnels, and decisions.
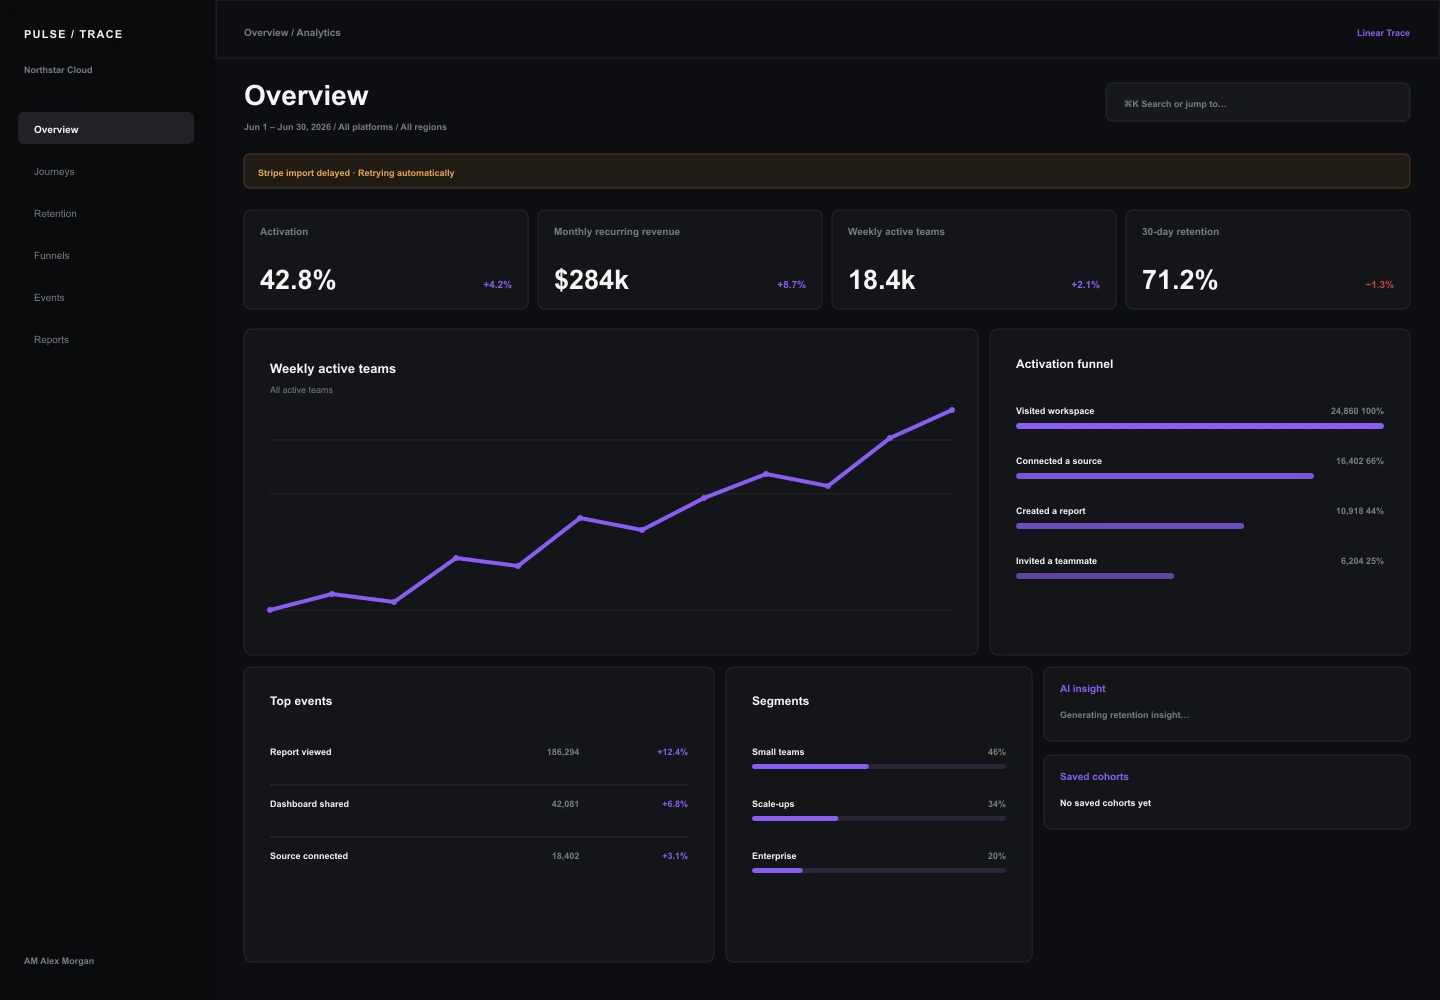
A precise graphite workspace uses restrained violet signals and tight geometry to prioritize analytical flow.
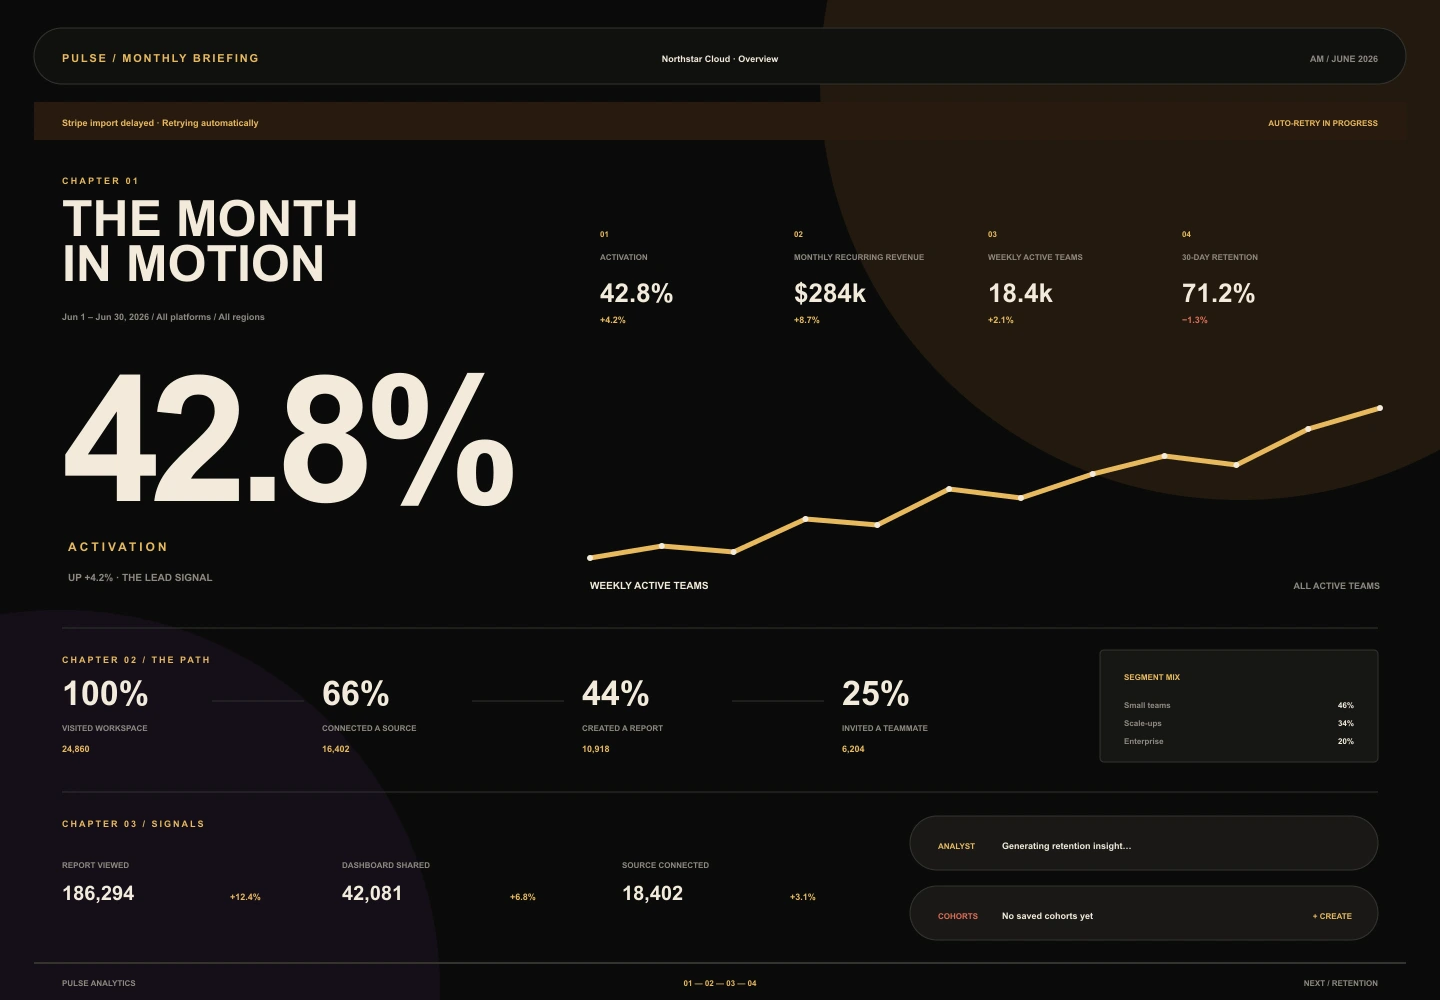
A dark cinematic briefing sequences product health into chapters, using large numbers and disciplined pacing for high-stakes review.
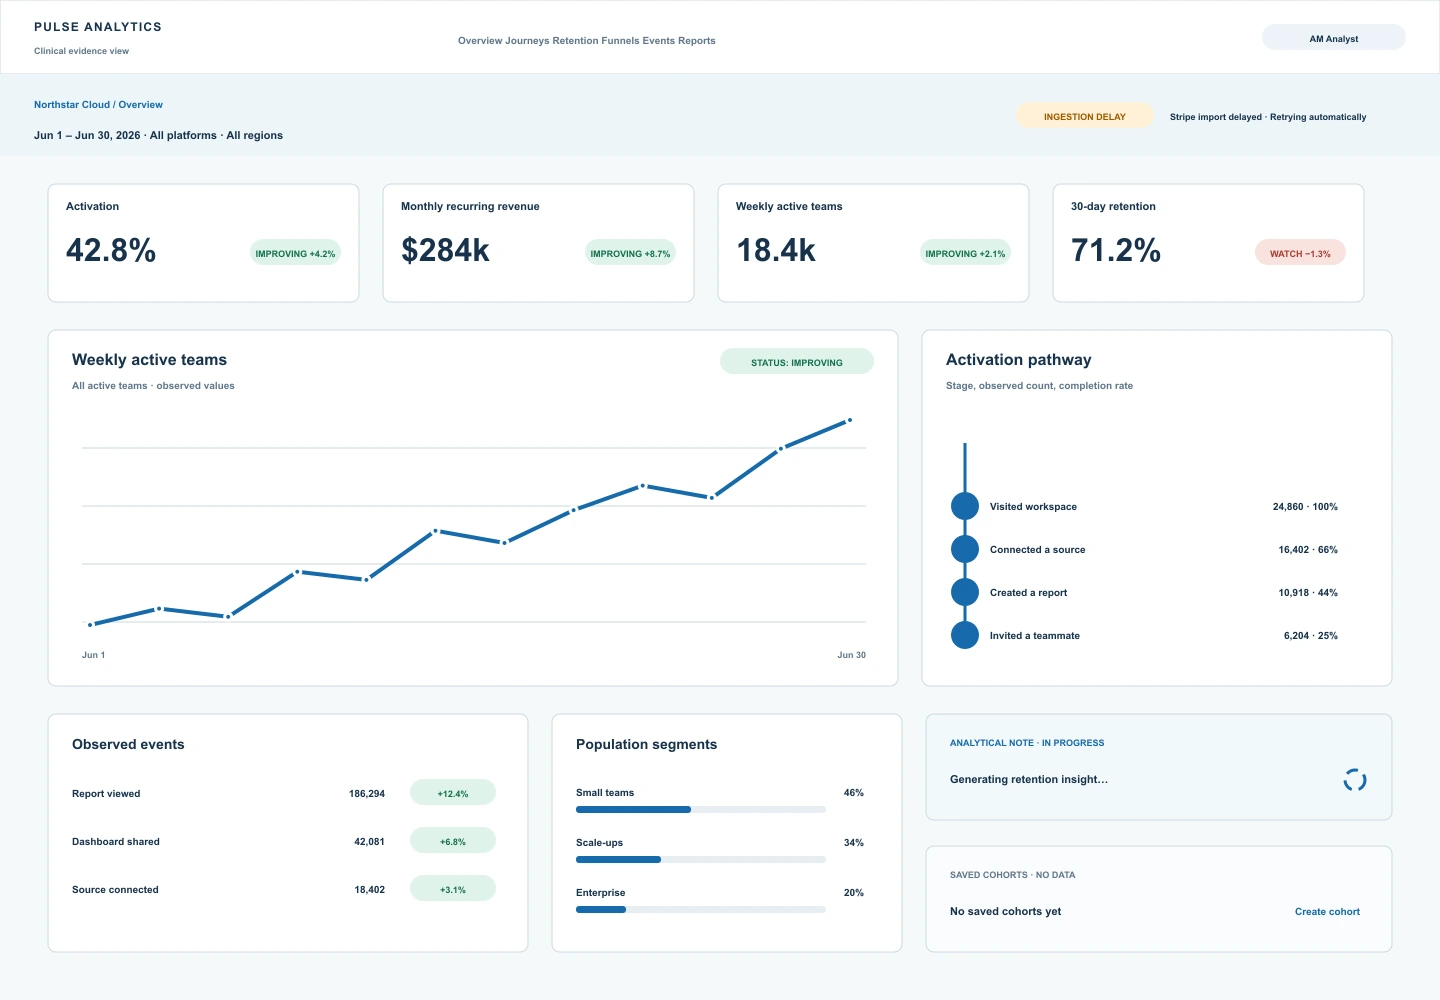
A clinically calm atlas prioritizes explicit statuses, readable chart notation, and evidence over ornamental dashboard chrome.
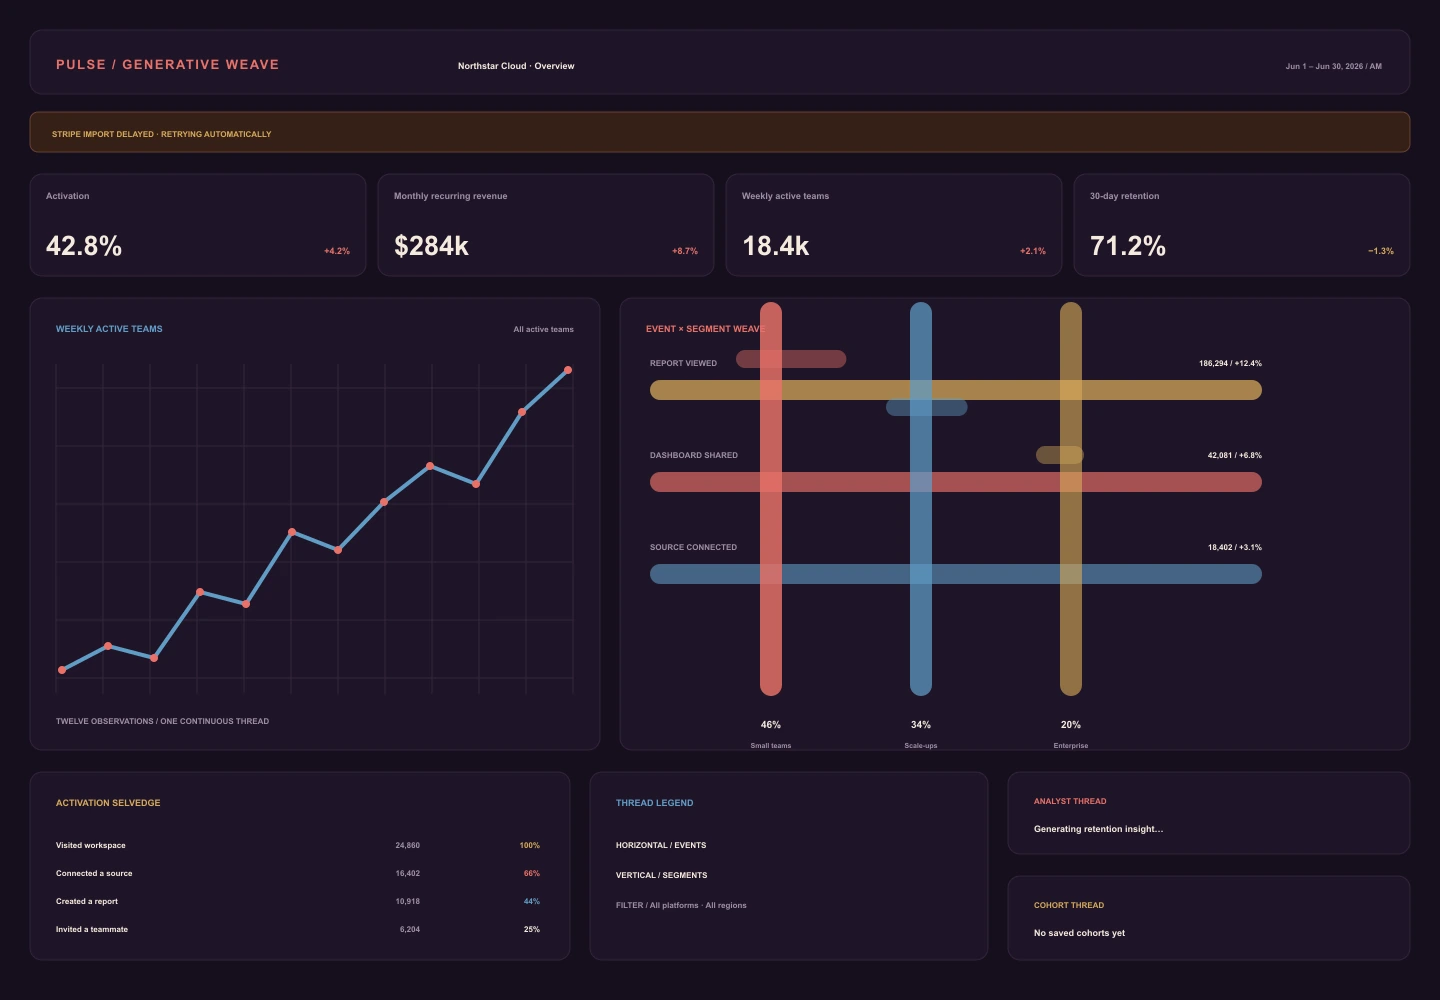
Interlaced data threads encode scale and relationship as a woven analytical surface.
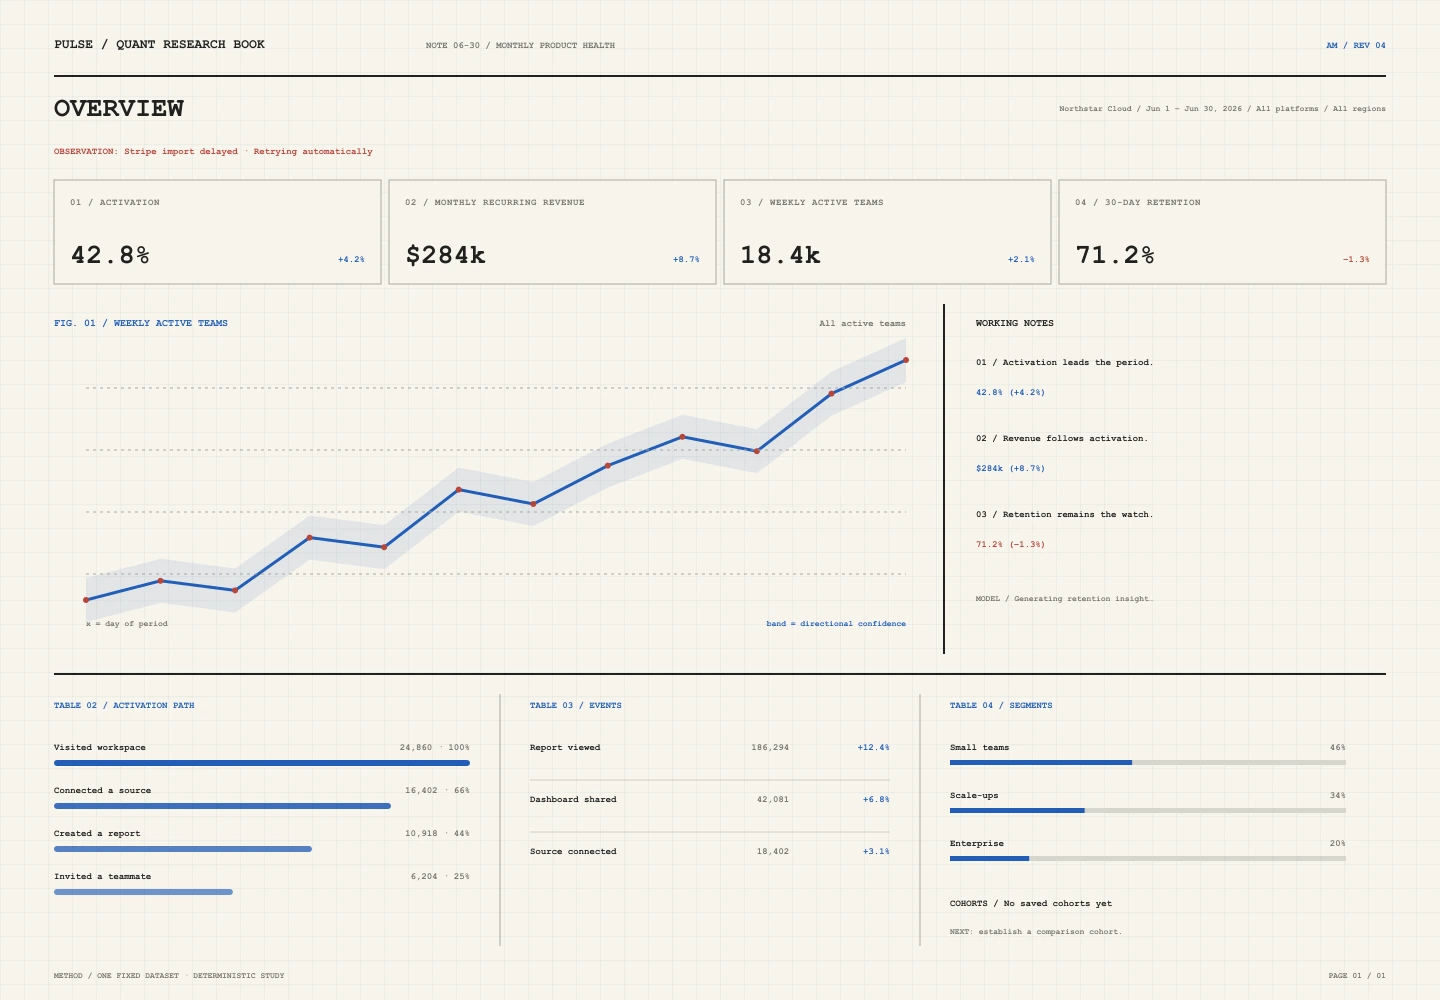
A quantitative notebook pairs every result with method-like annotation, thresholds, and visible working context.
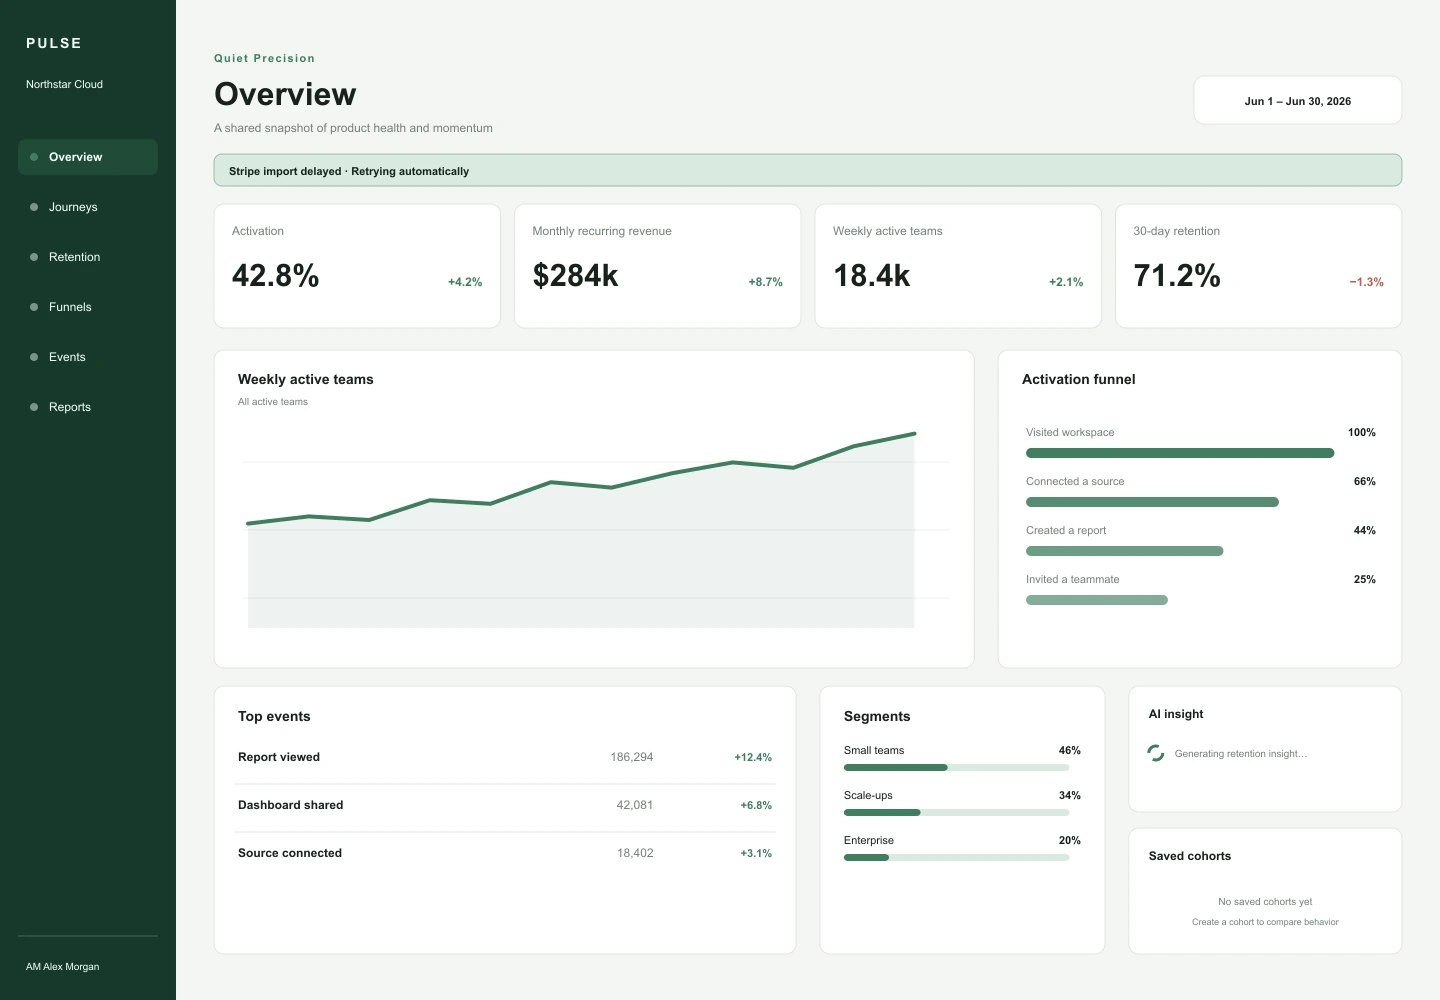
A restrained system that uses whitespace and one signal color to make dense product data feel calm.
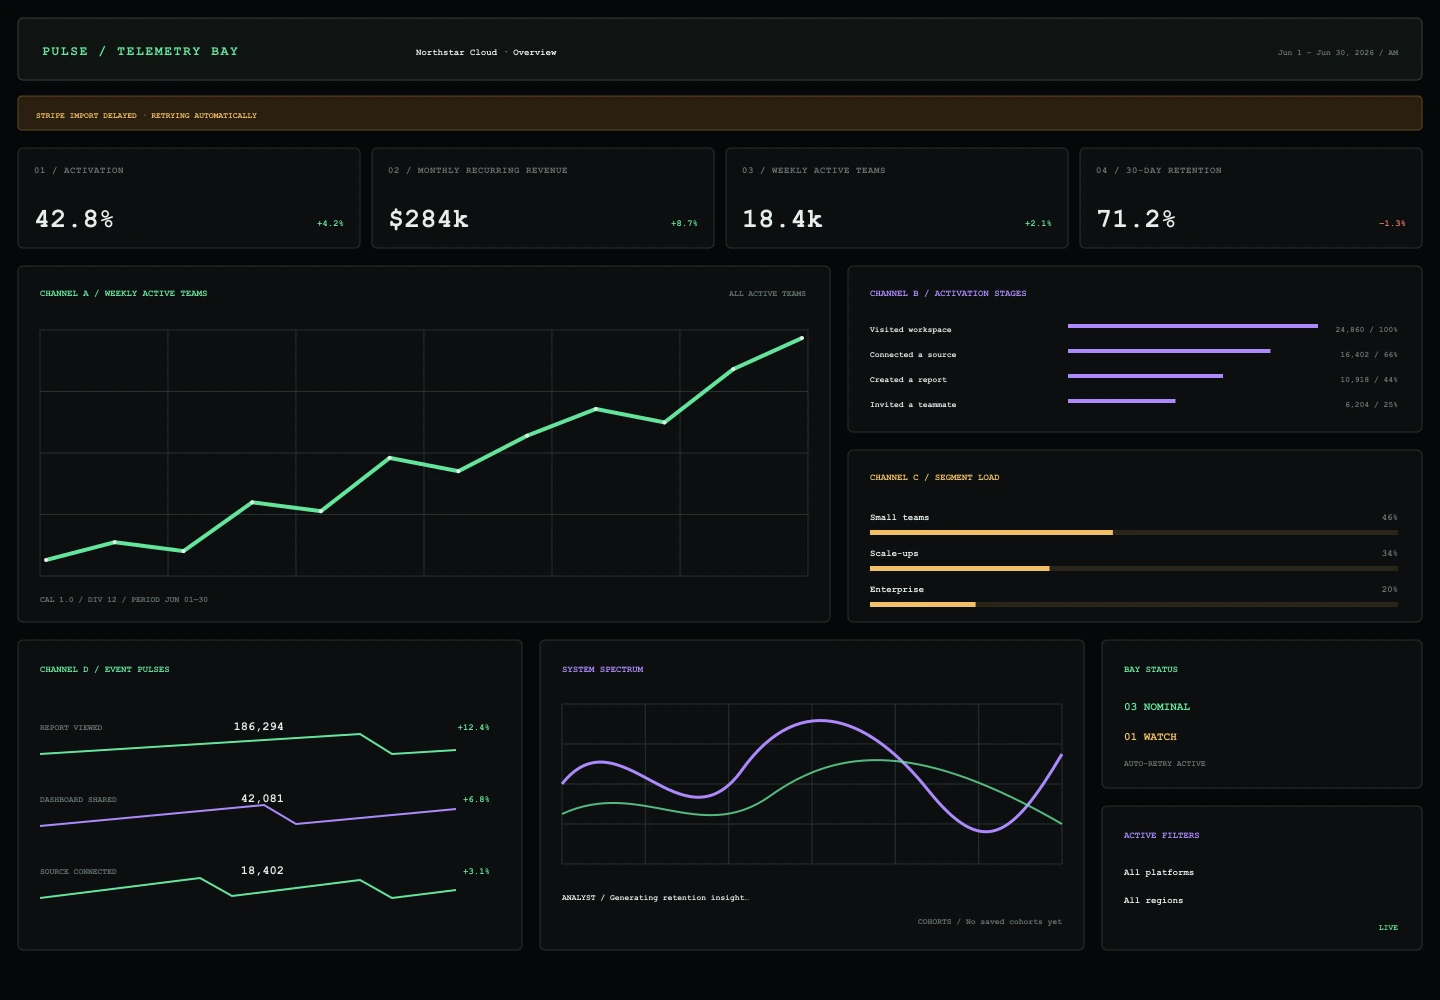
A telemetry bay gives every product signal its own instrument while keeping the entire system in view.
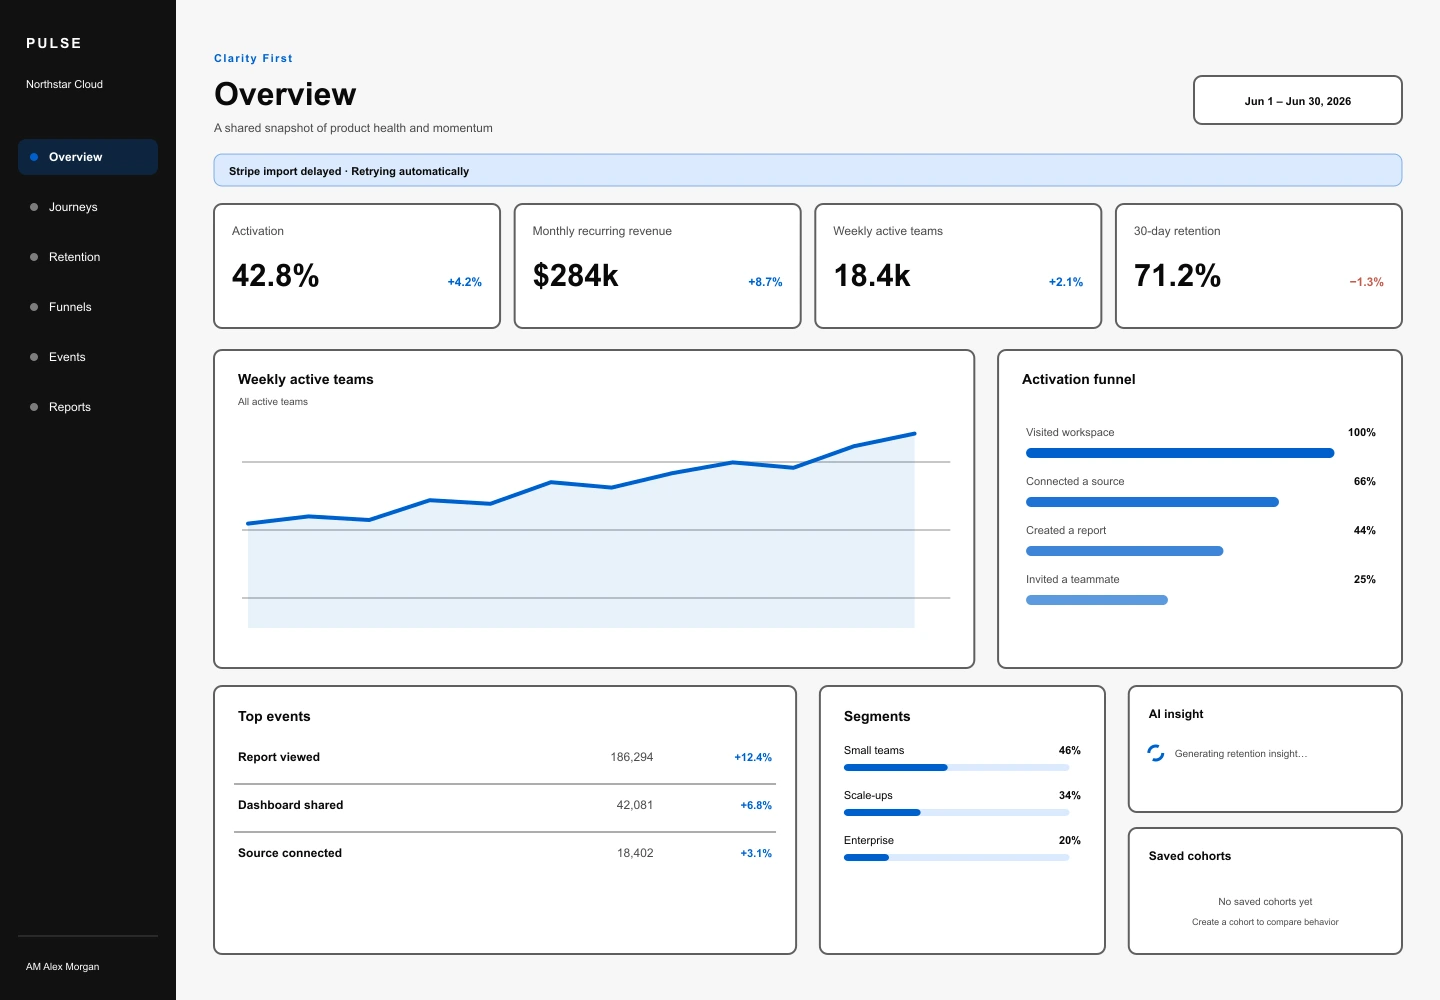
An accessibility-led system where strong boundaries, large labels, and redundant status cues prioritize confident reading.
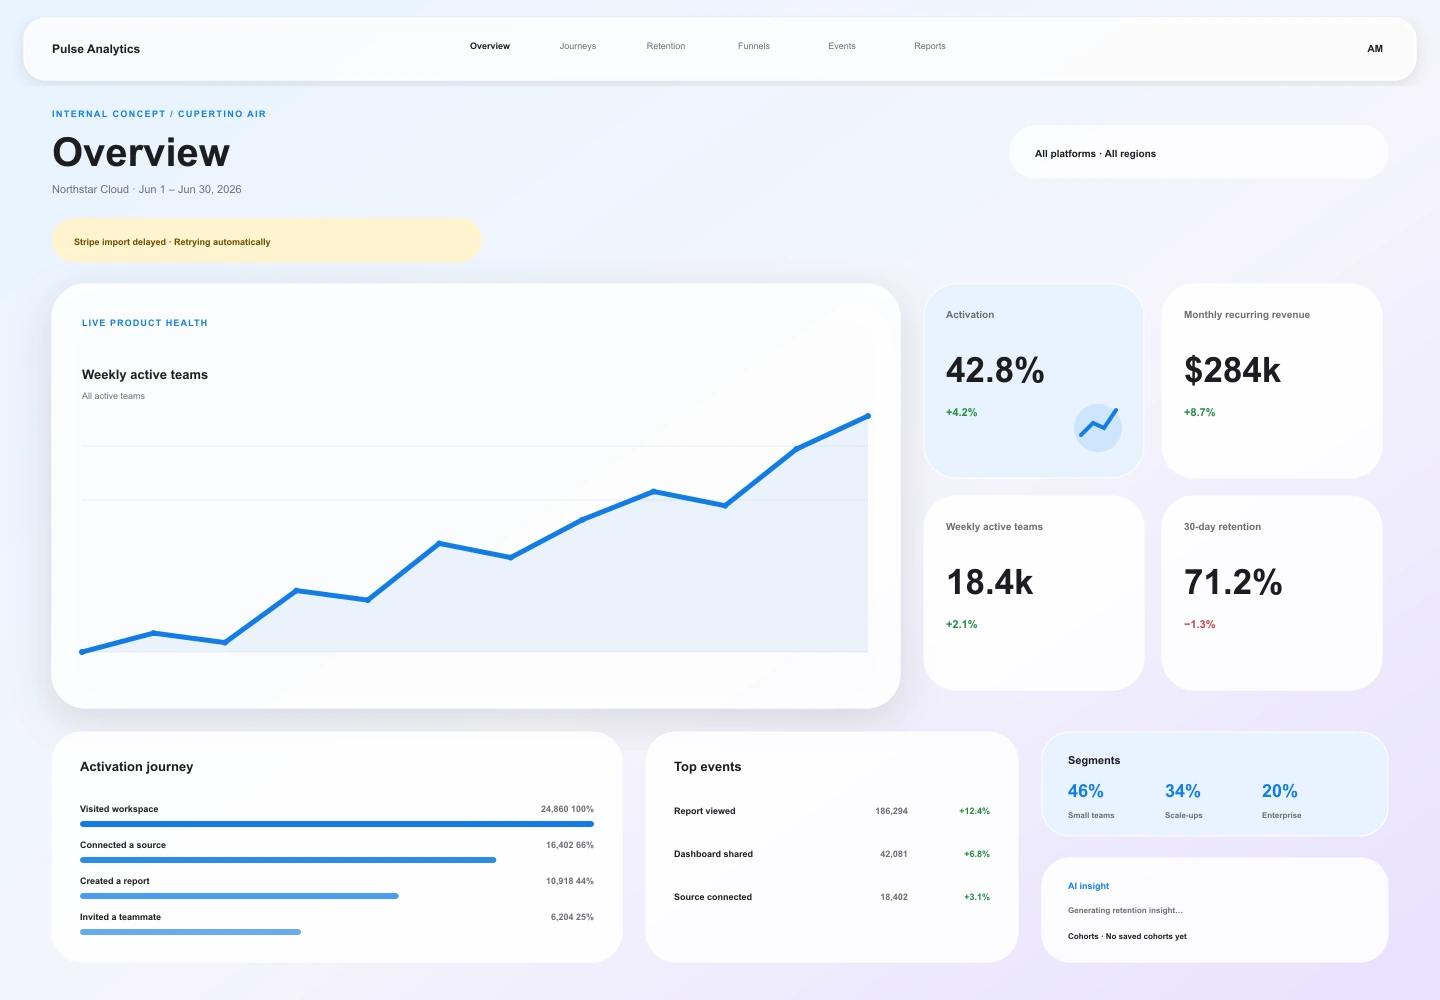
An original visual-first product study stages analytics as a set of airy, softly layered instruments.
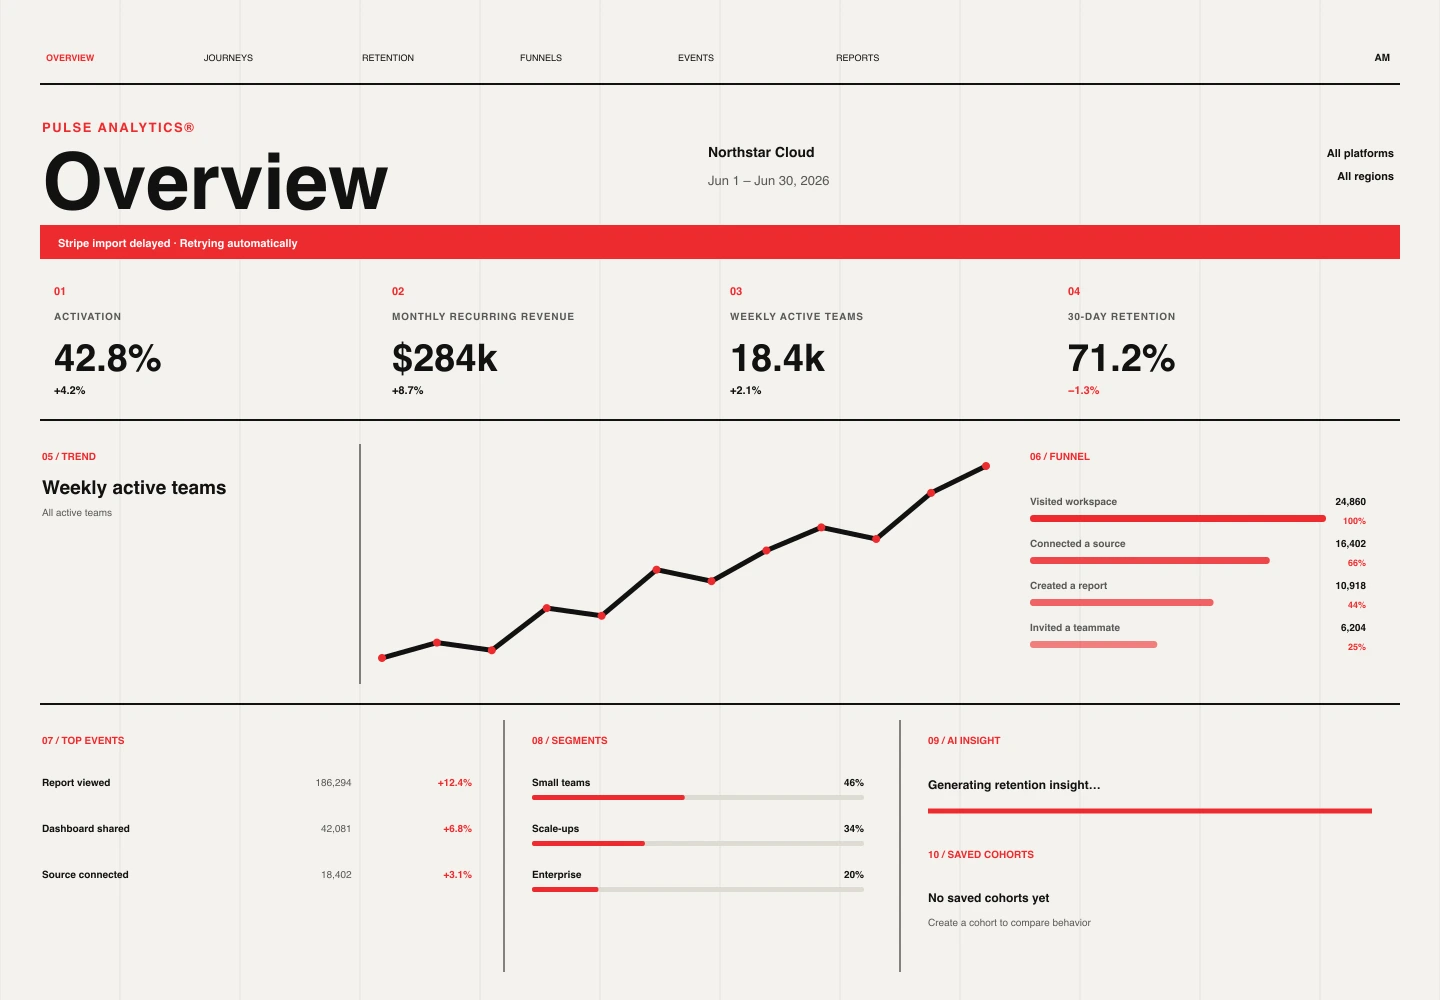
An uncompromising Swiss grid uses scale, numbering, and alignment instead of containers to organize the workspace.
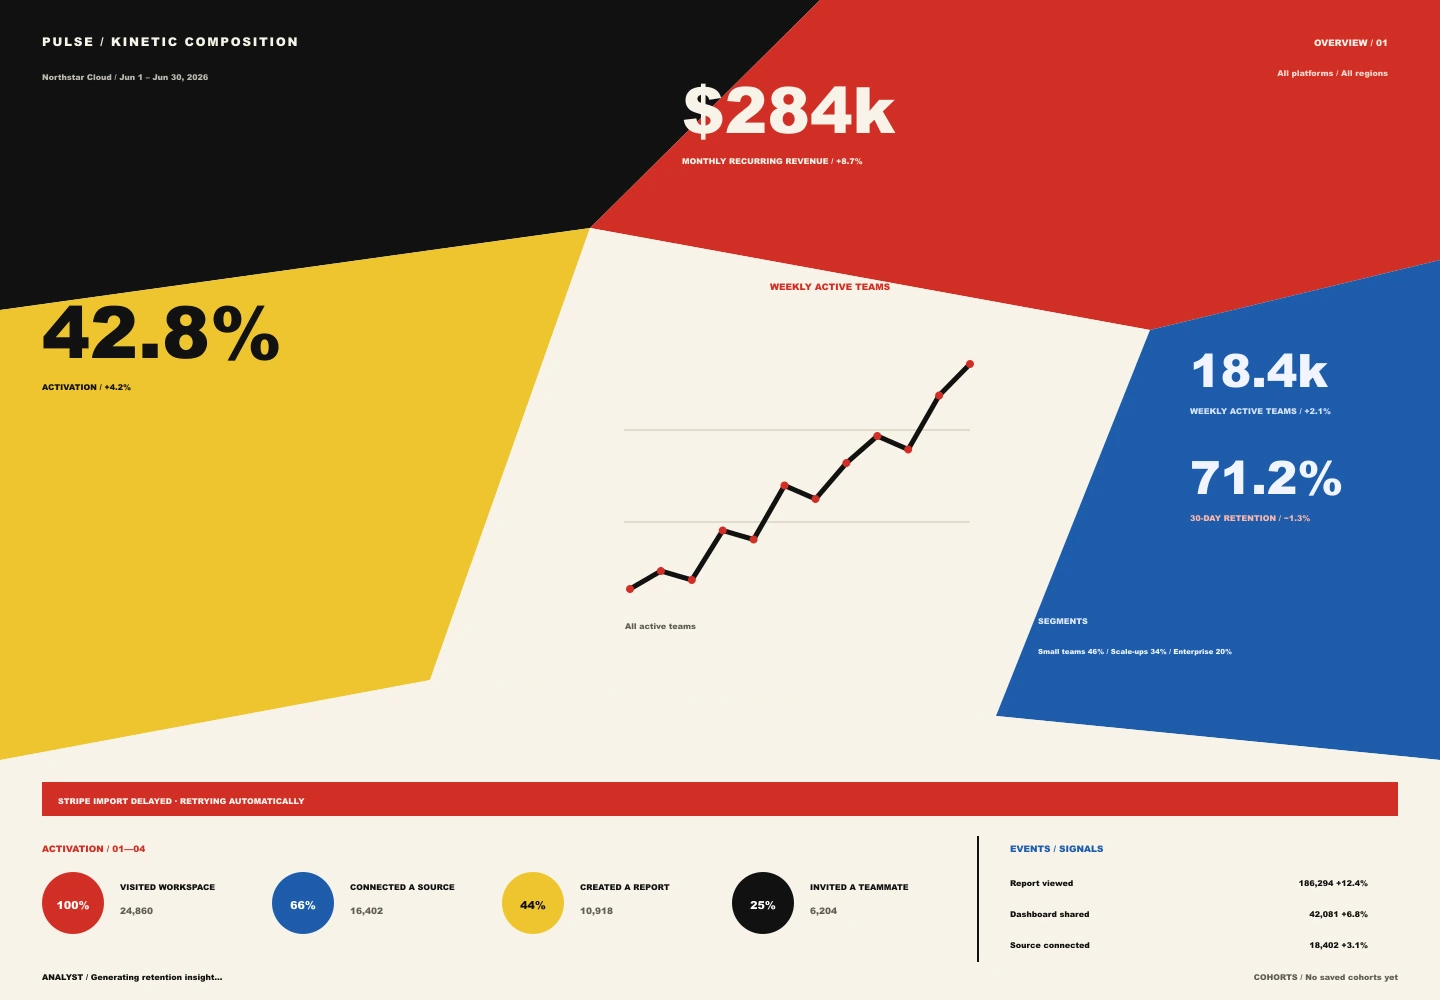
A directional composition turns product movement into intersecting planes, axes, and emphatic numerical type.
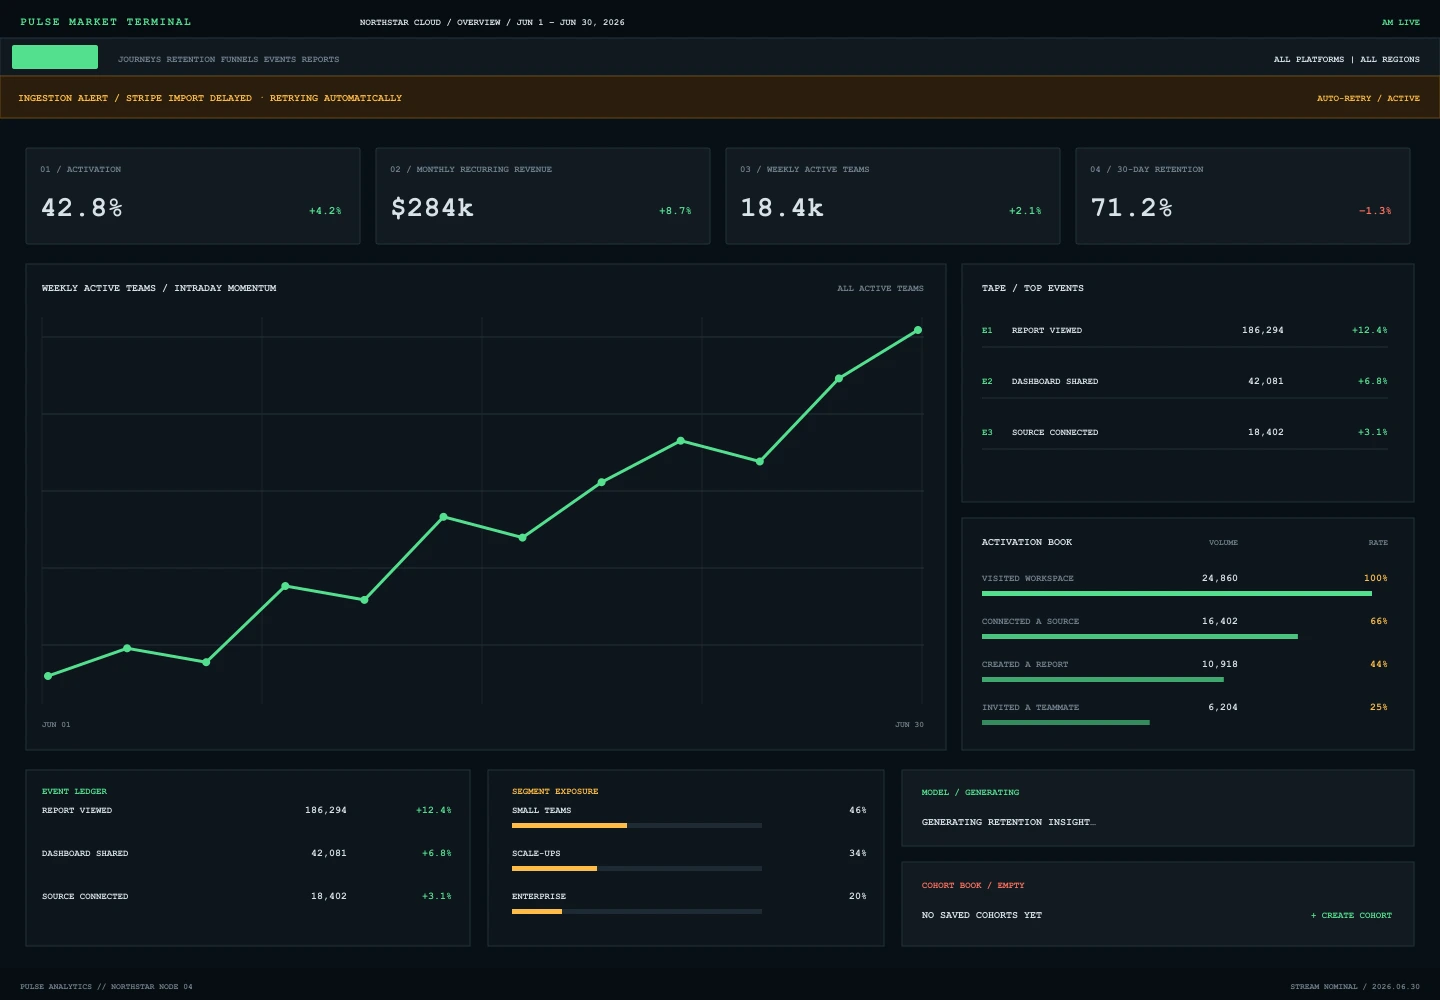
A maximum-density market terminal treats every product signal as a live instrument in one tightly coordinated trading floor.
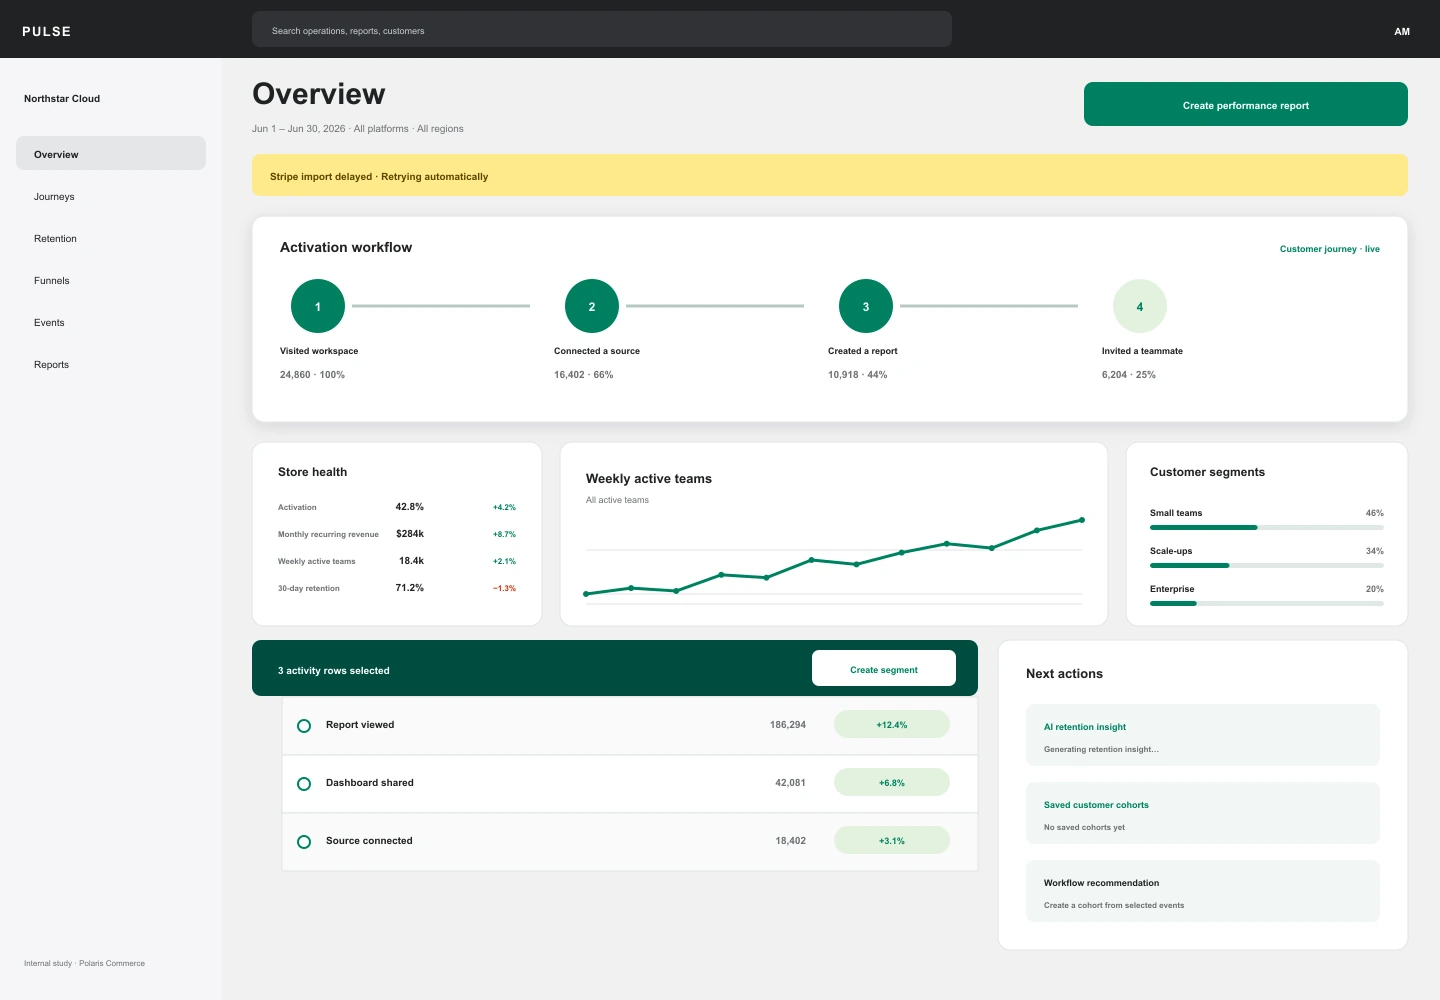
A commerce-oriented admin study combines approachable cards with a green contextual action layer.
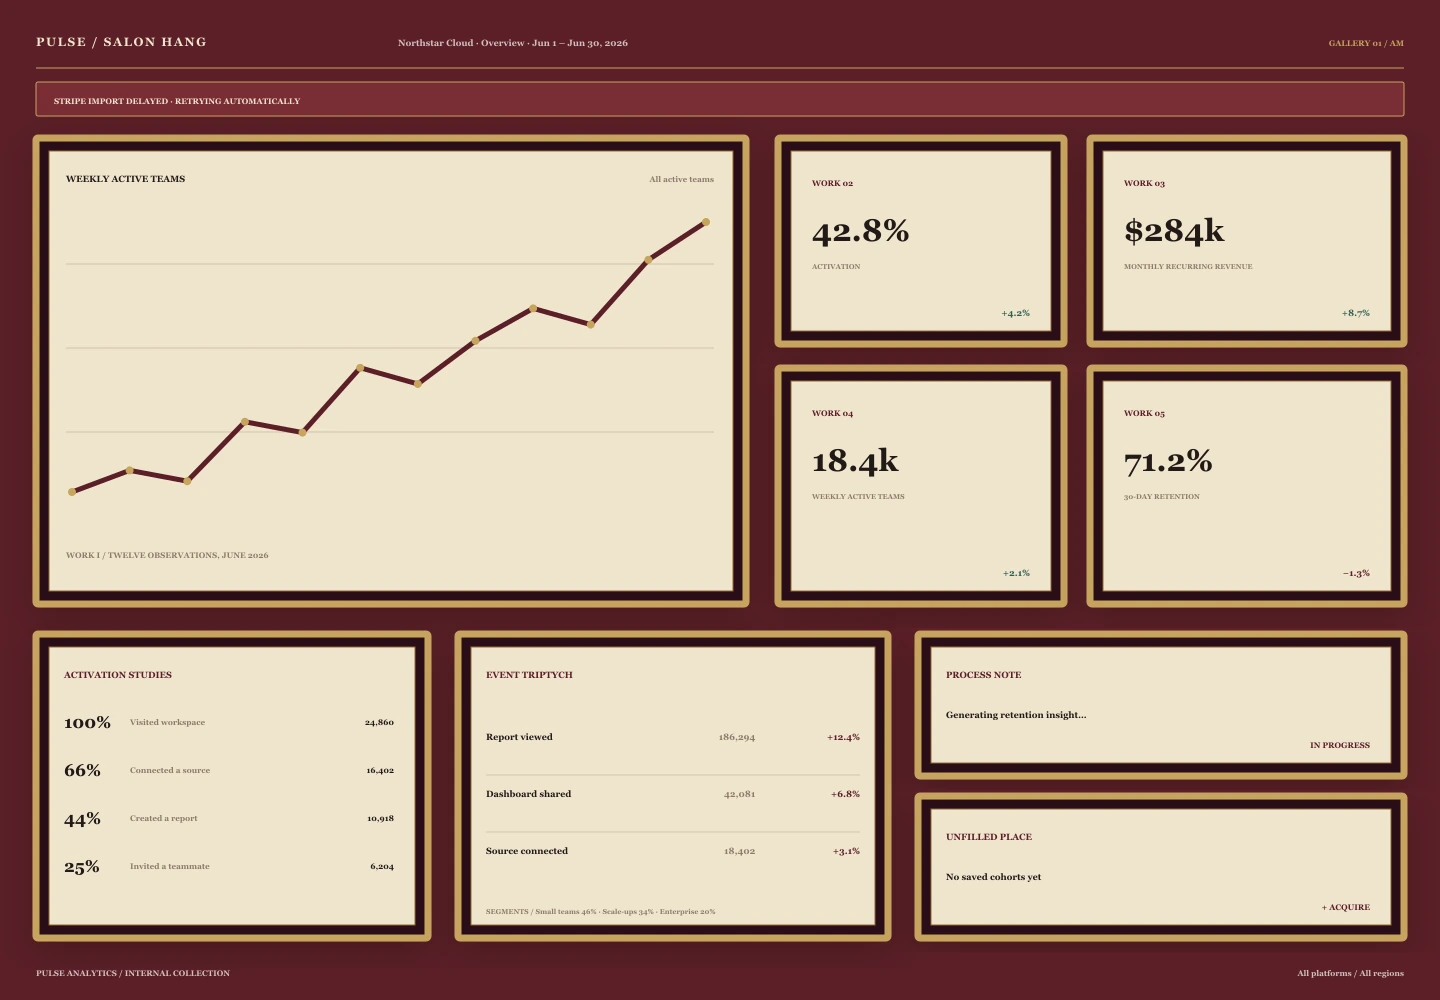
A salon wall arranges analytical views as a dense but curated family of framed works.
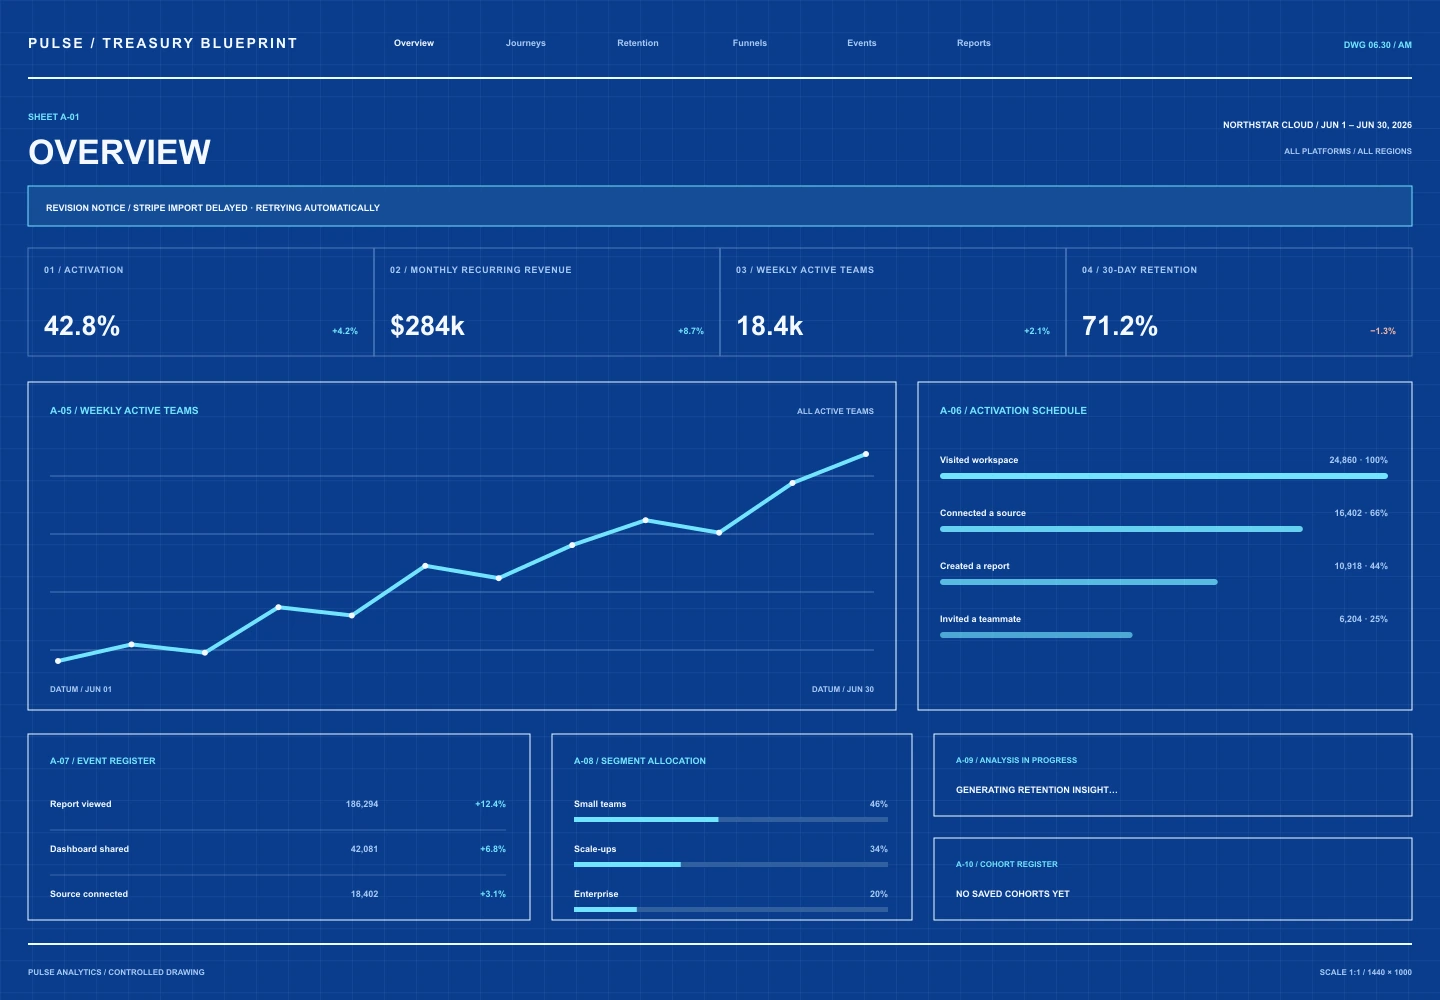
An institutional blueprint treats every measure as a reconciled instrument in a controlled financial plan.
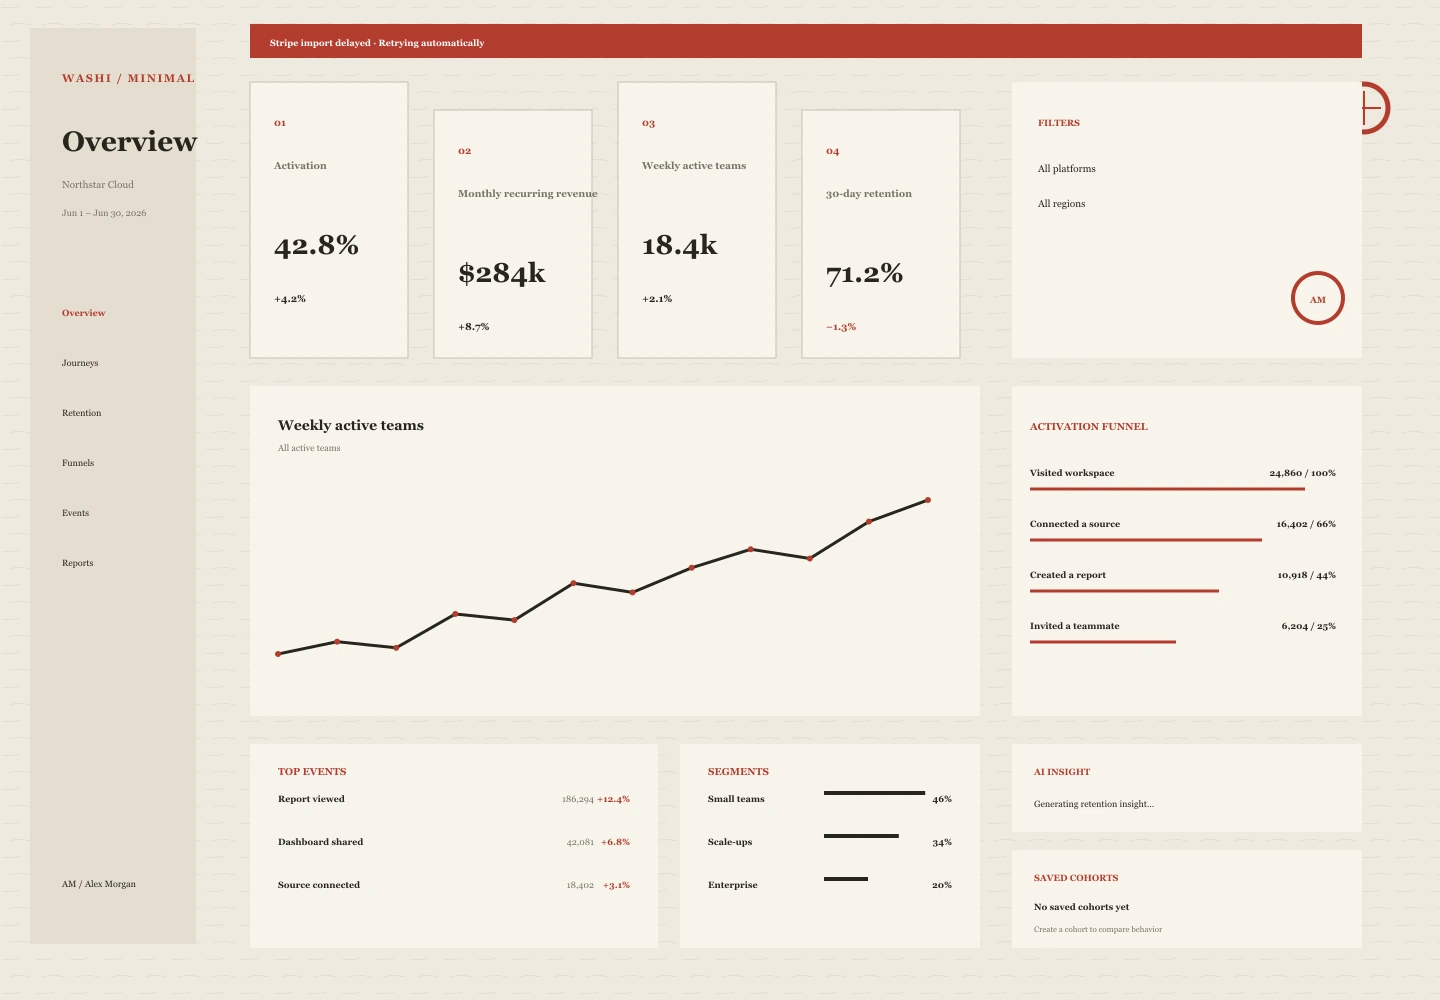
A quiet paper surface uses generous intervals, vertical rhythm, and restrained vermilion seals to support unhurried analysis.
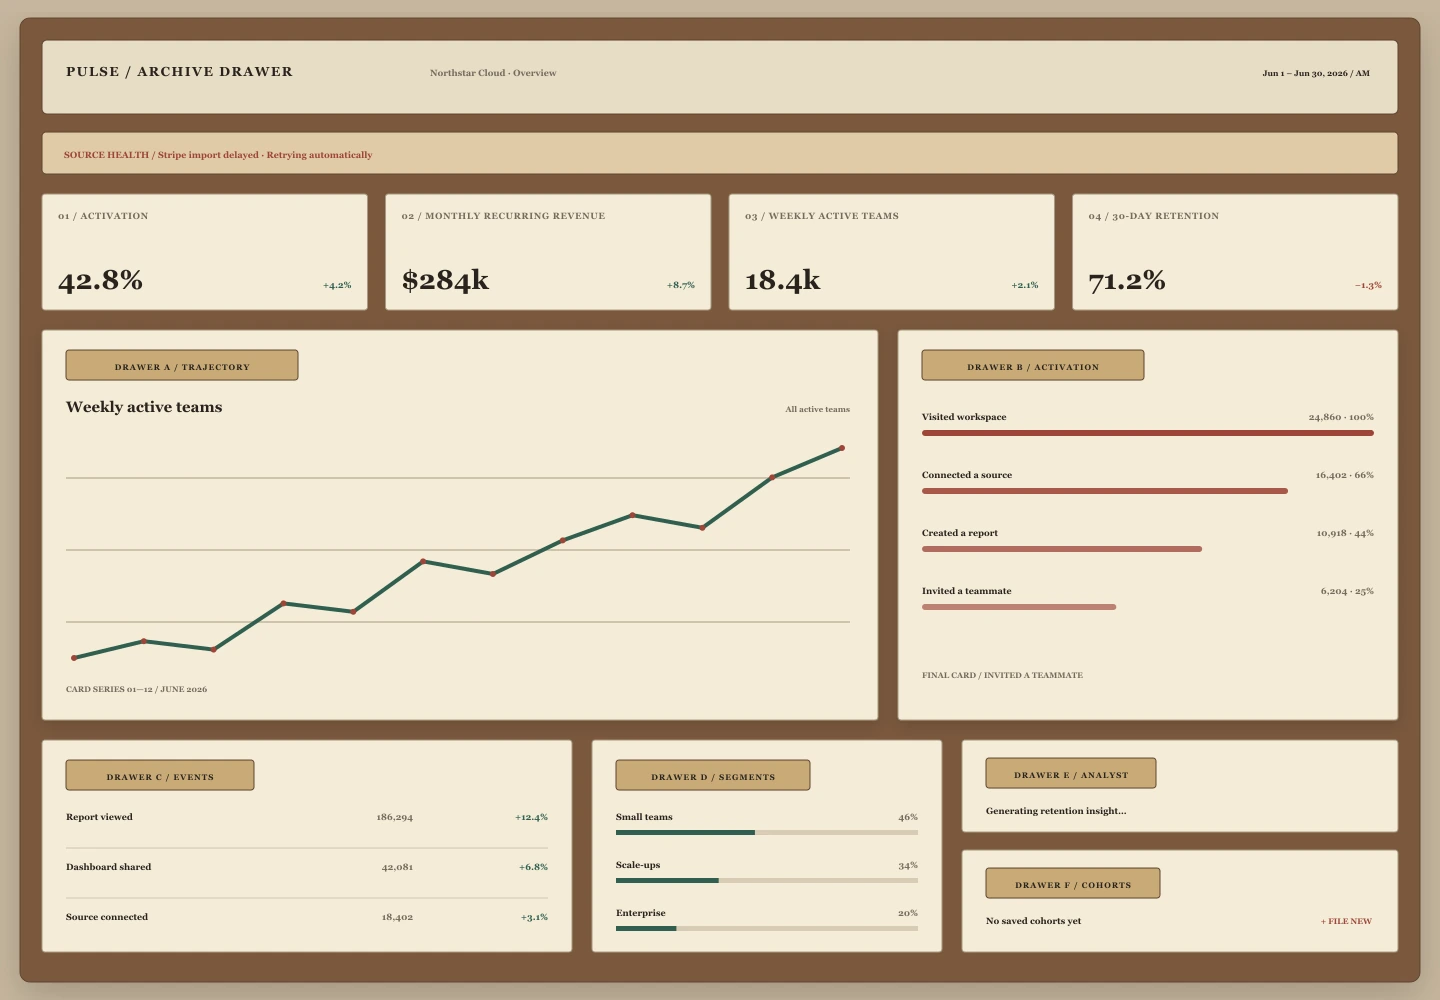
A working archive places the analytics state into labeled drawers, index cards, and durable reference fields.
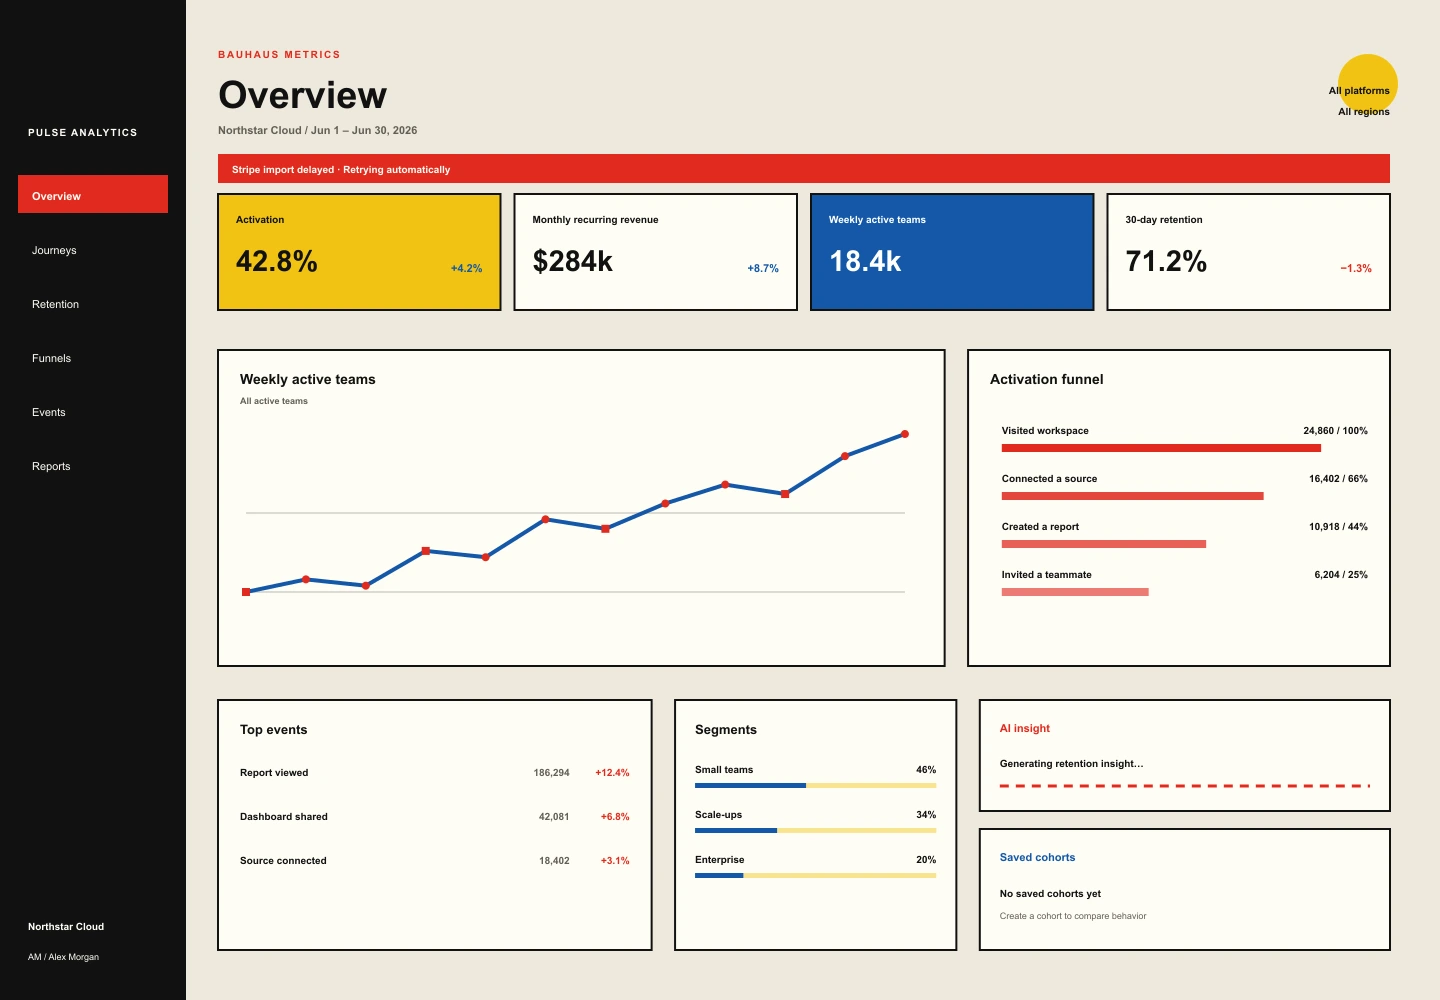
Primary geometry turns an operational dashboard into a disciplined composition of circles, bars, and sharply bounded modules.
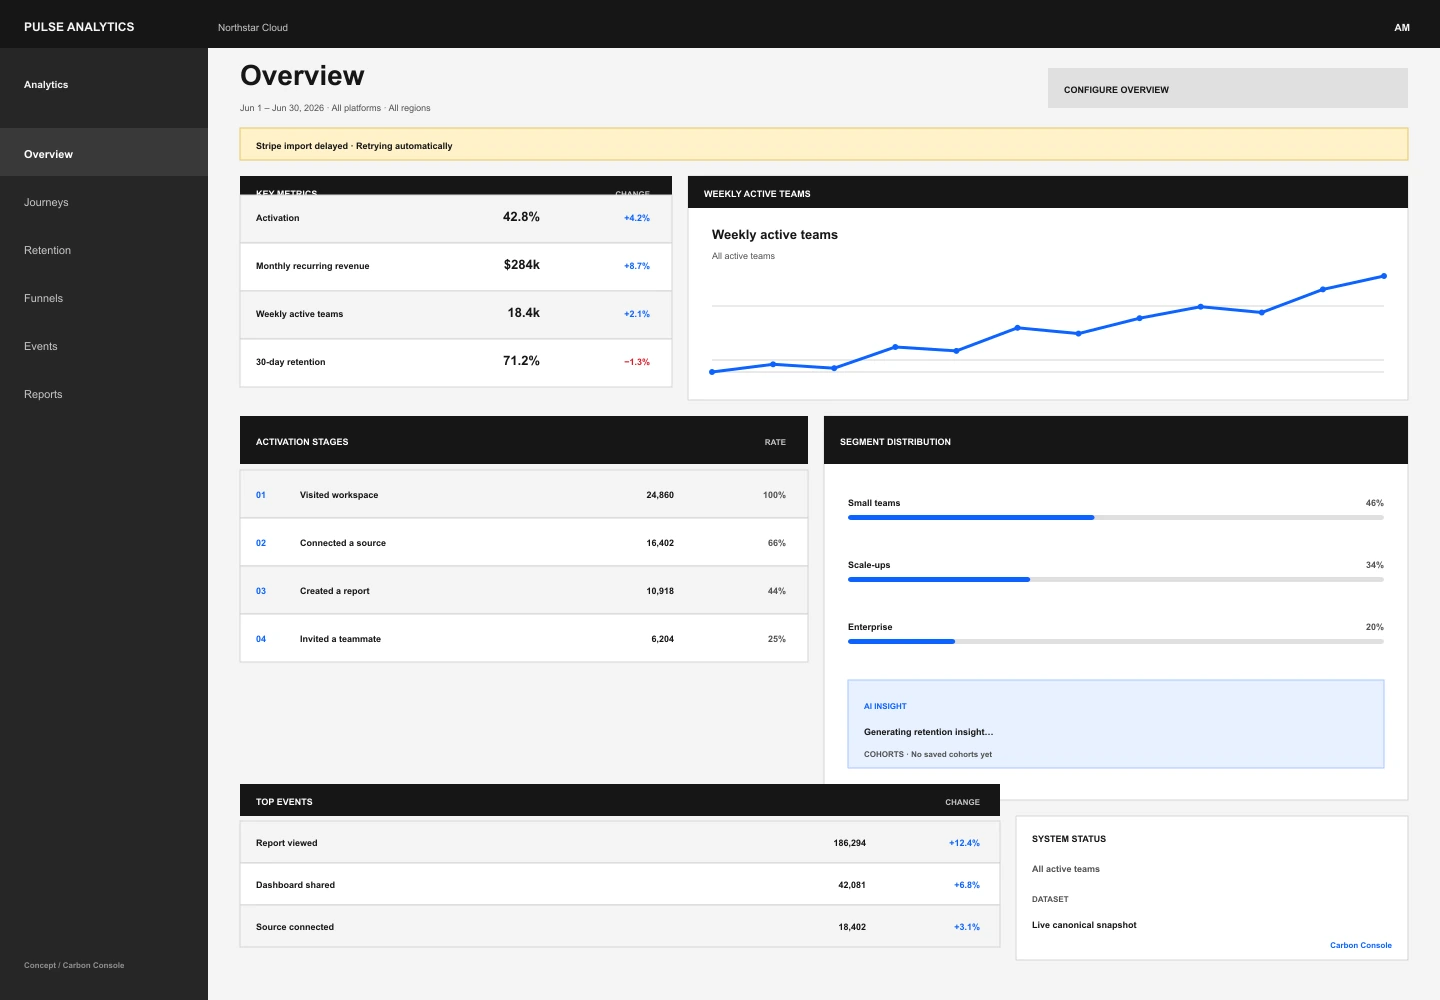
A high-contrast enterprise console uses a strict two-unit grid and blue operational signals.
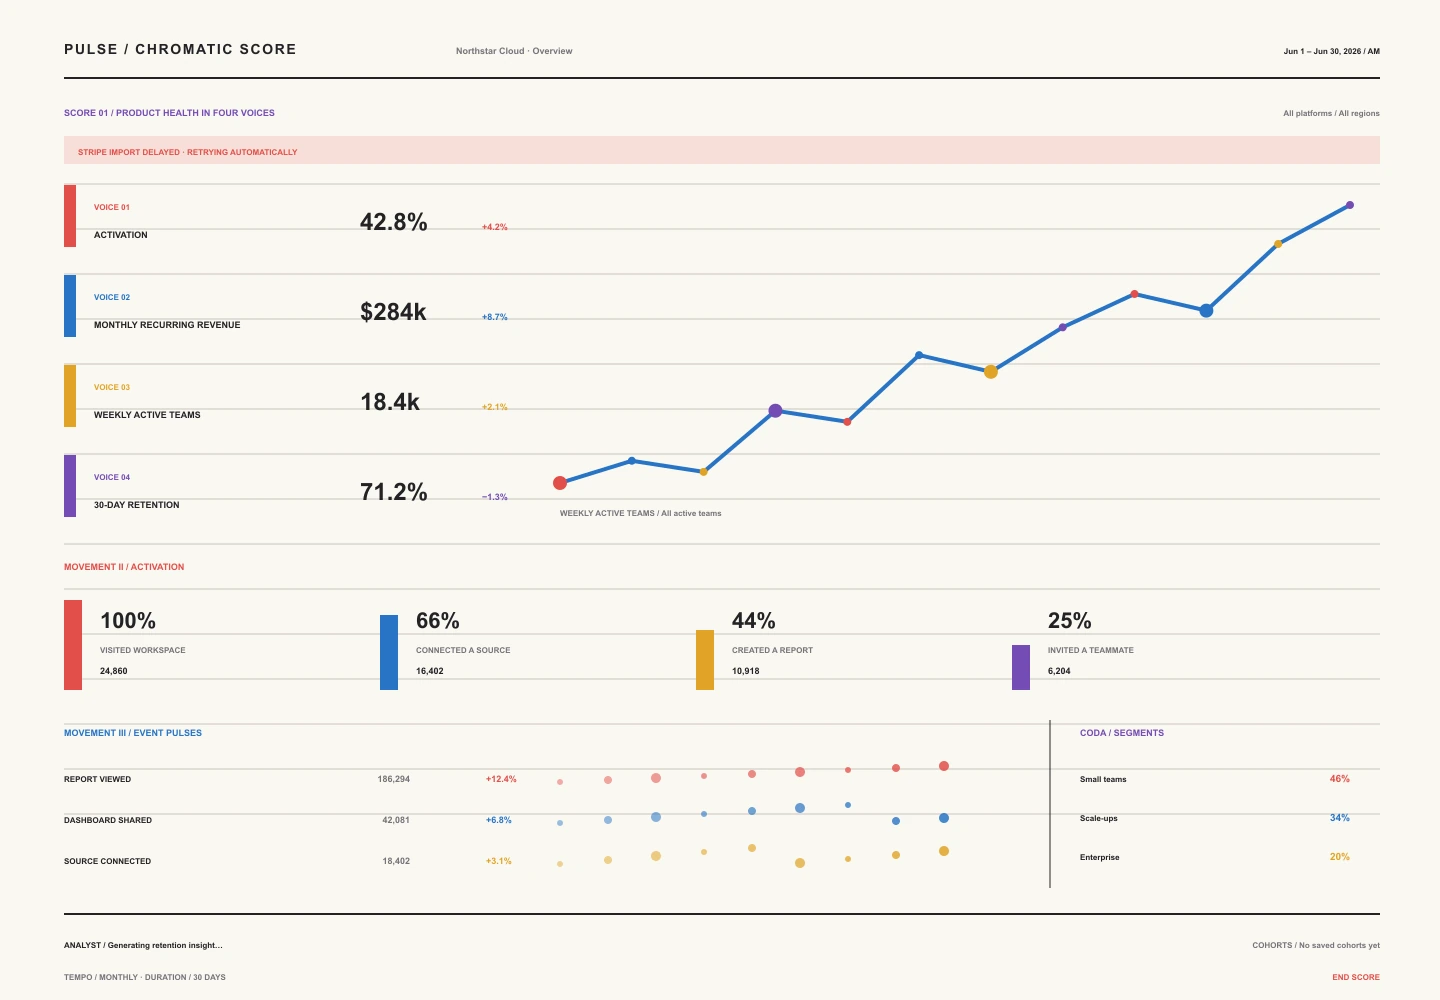
A measured visual score assigns every metric, event, and segment a place in one continuous analytical performance.
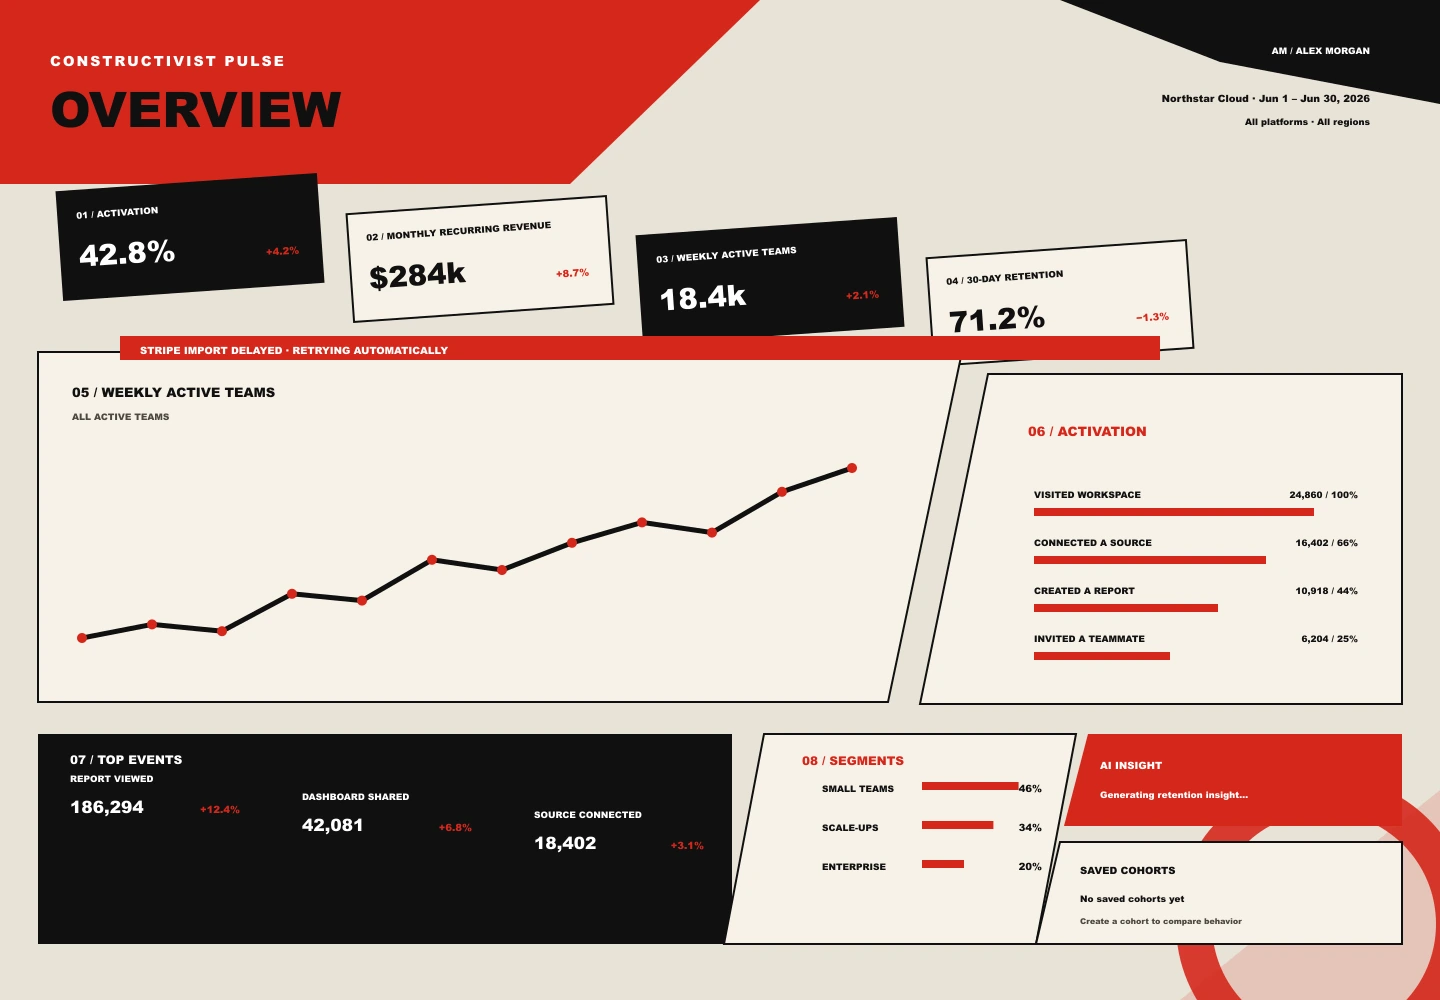
Red and black diagonals turn the analytics overview into an urgent editorial poster with a forceful reading sequence.
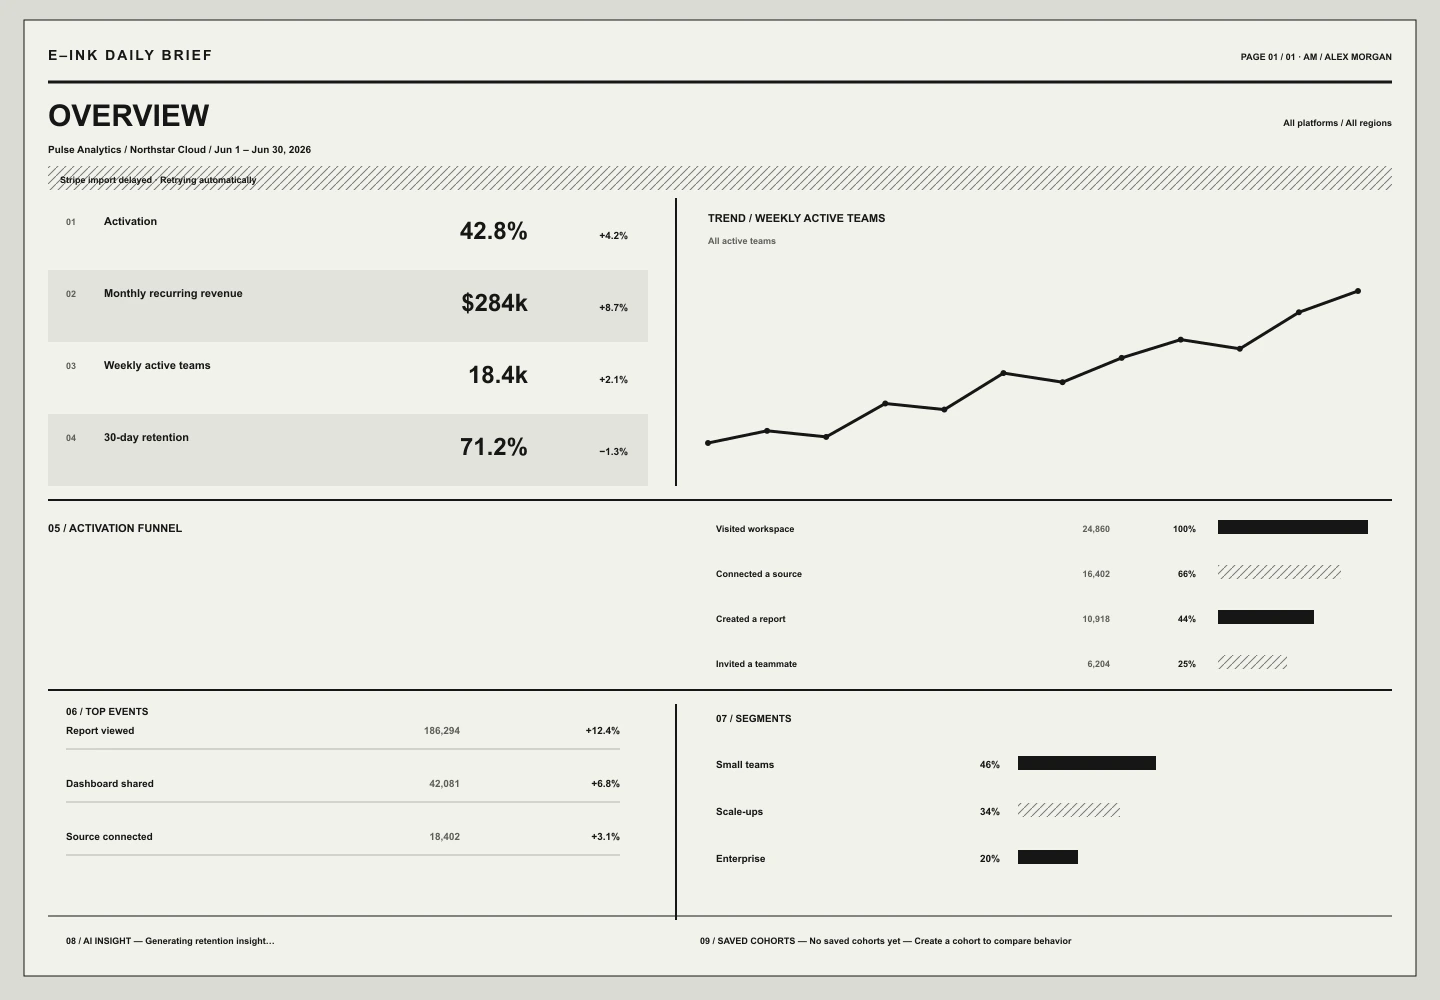
A grayscale operational brief uses dithered fills, sharp type, and low-power display conventions to prioritize durable readability.
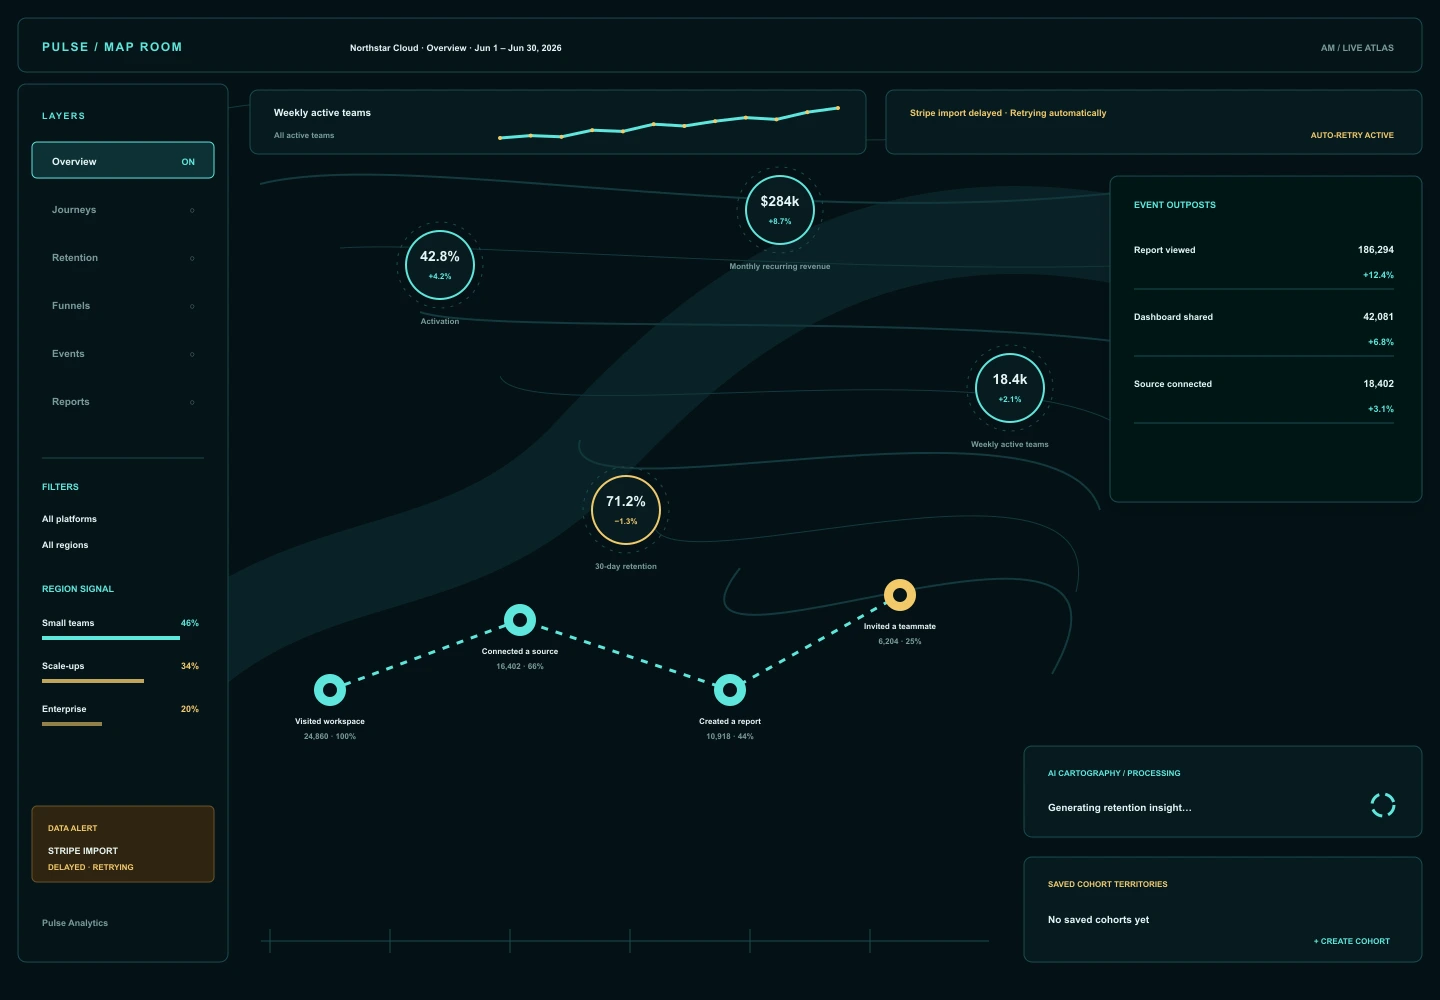
A map-centered operations room turns segments and conversion stages into territories layered across one continuous analytical canvas.
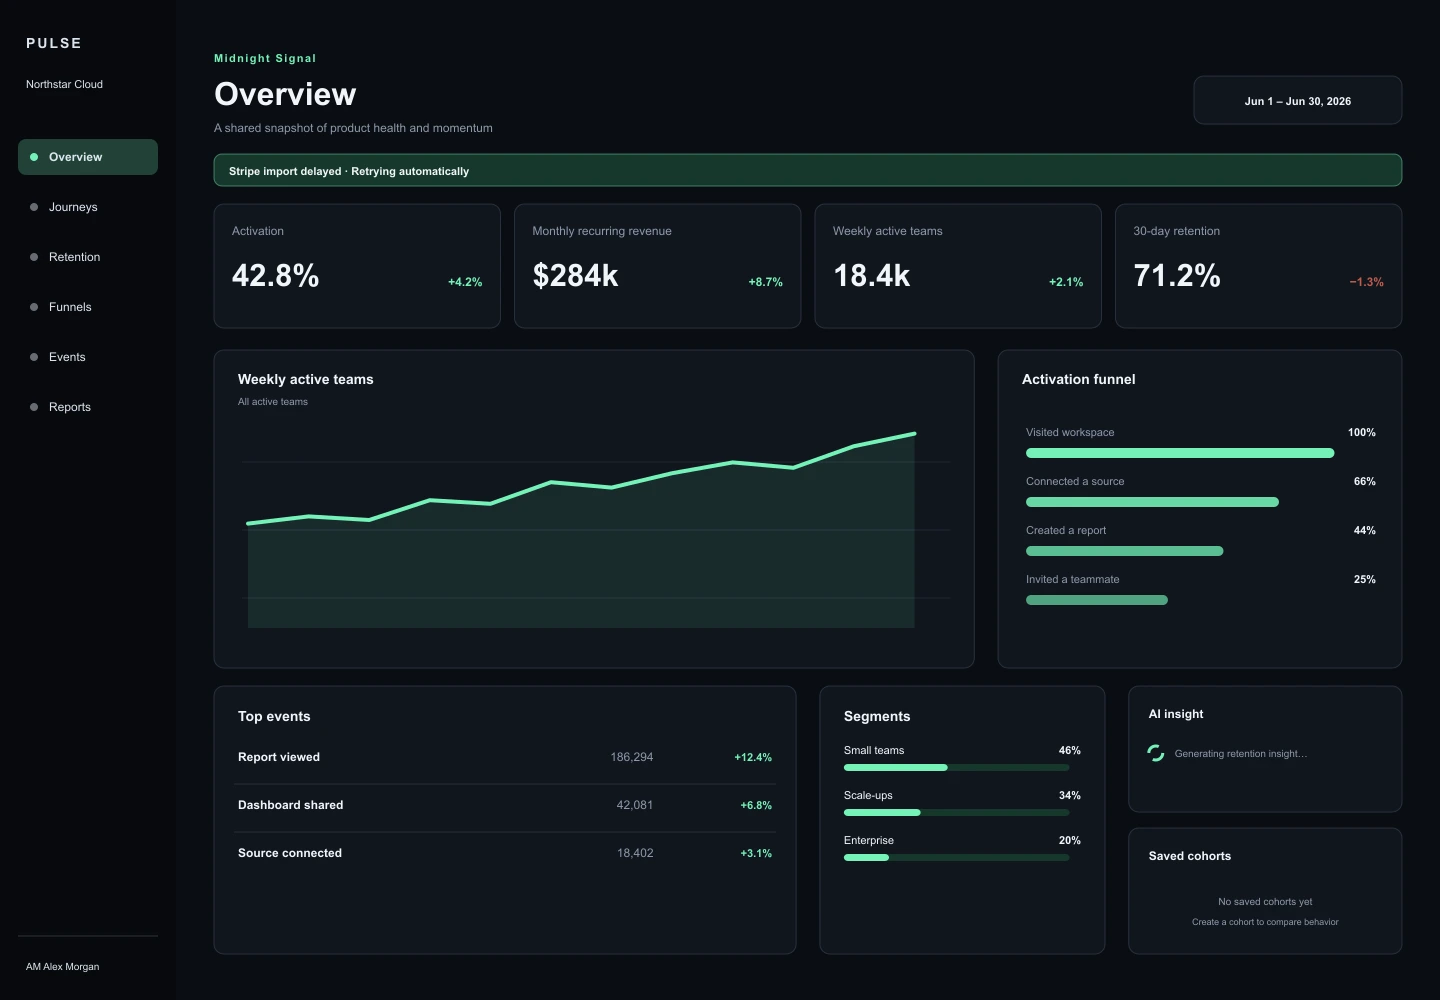
A dark operational workspace where mint signals and restrained borders preserve hierarchy without visual glare.
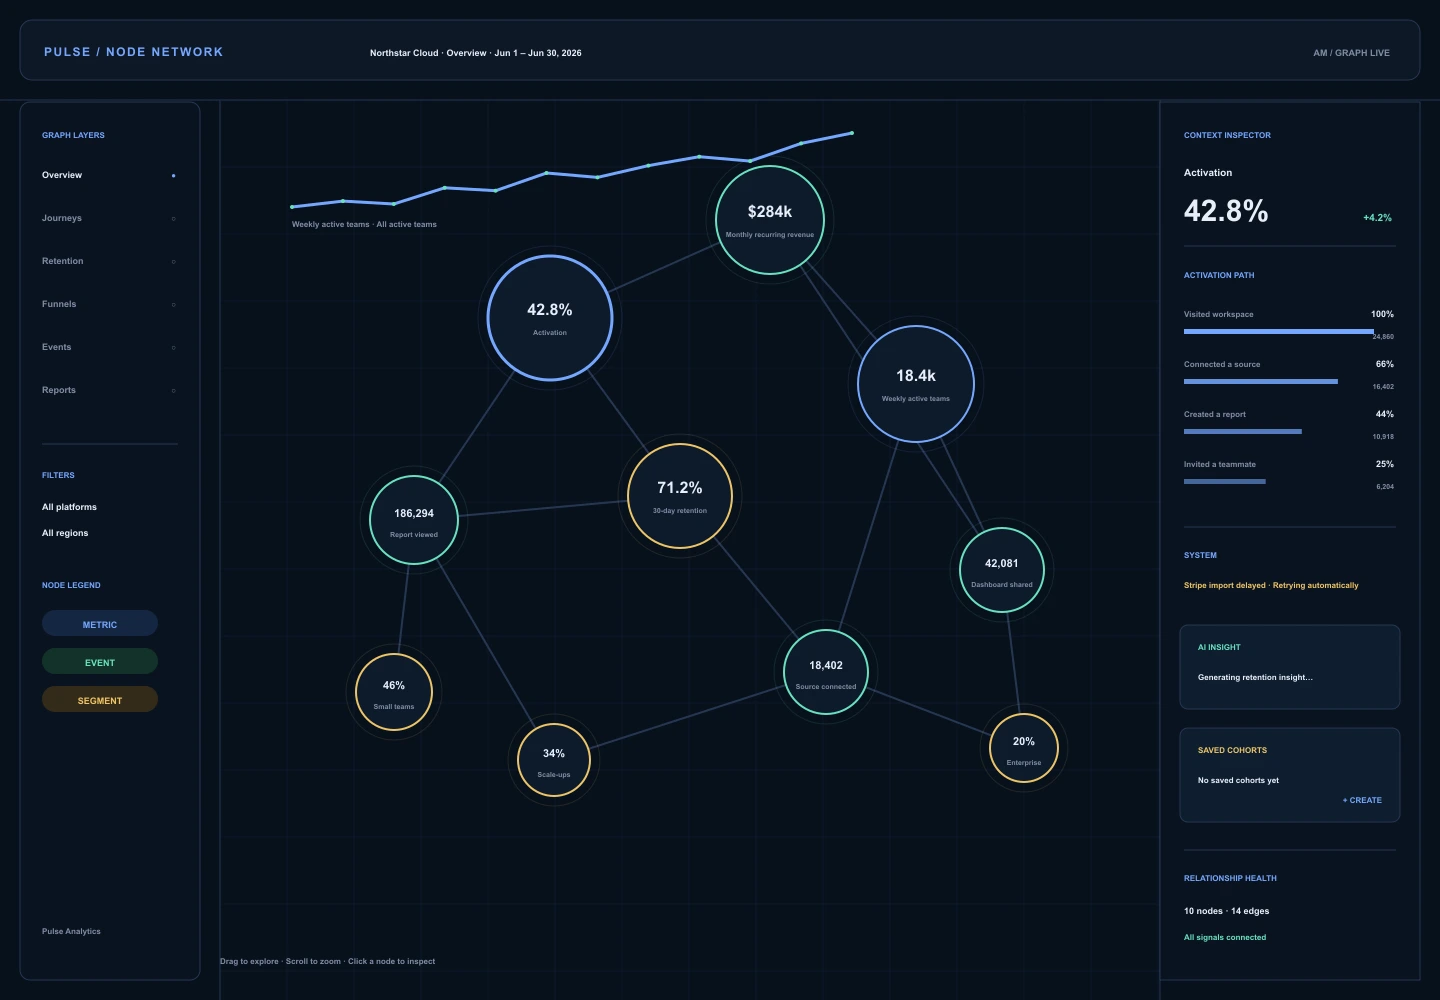
A relationship canvas models metrics, events, segments, and conversion stages as an explorable network of connected evidence.
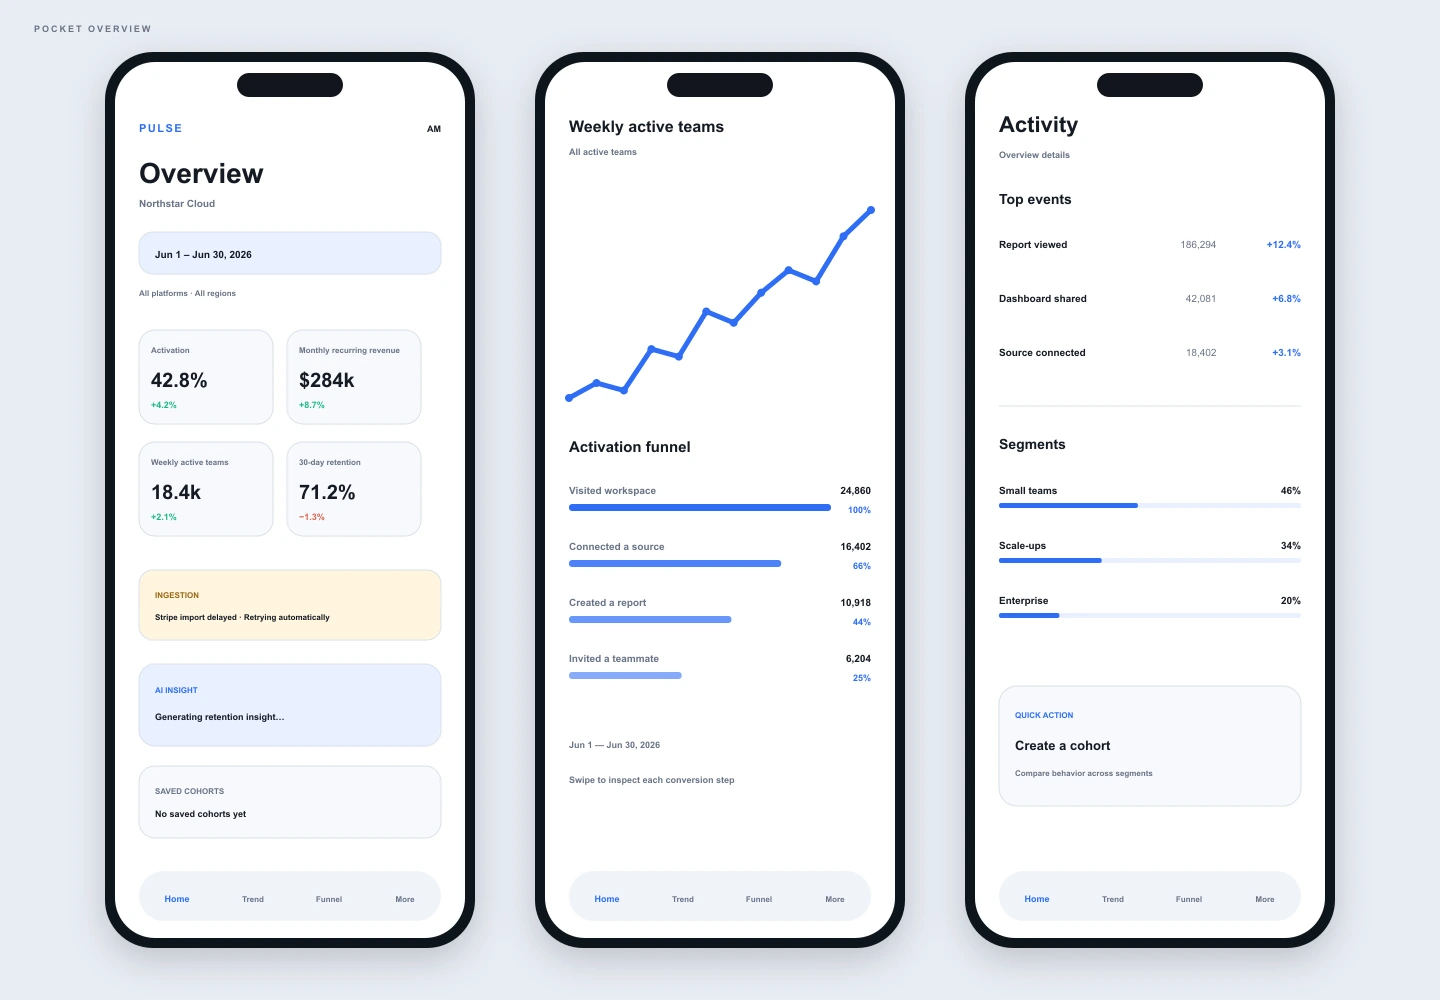
A mobile-first system distributes the complete analytics workspace across focused, thumb-friendly views.
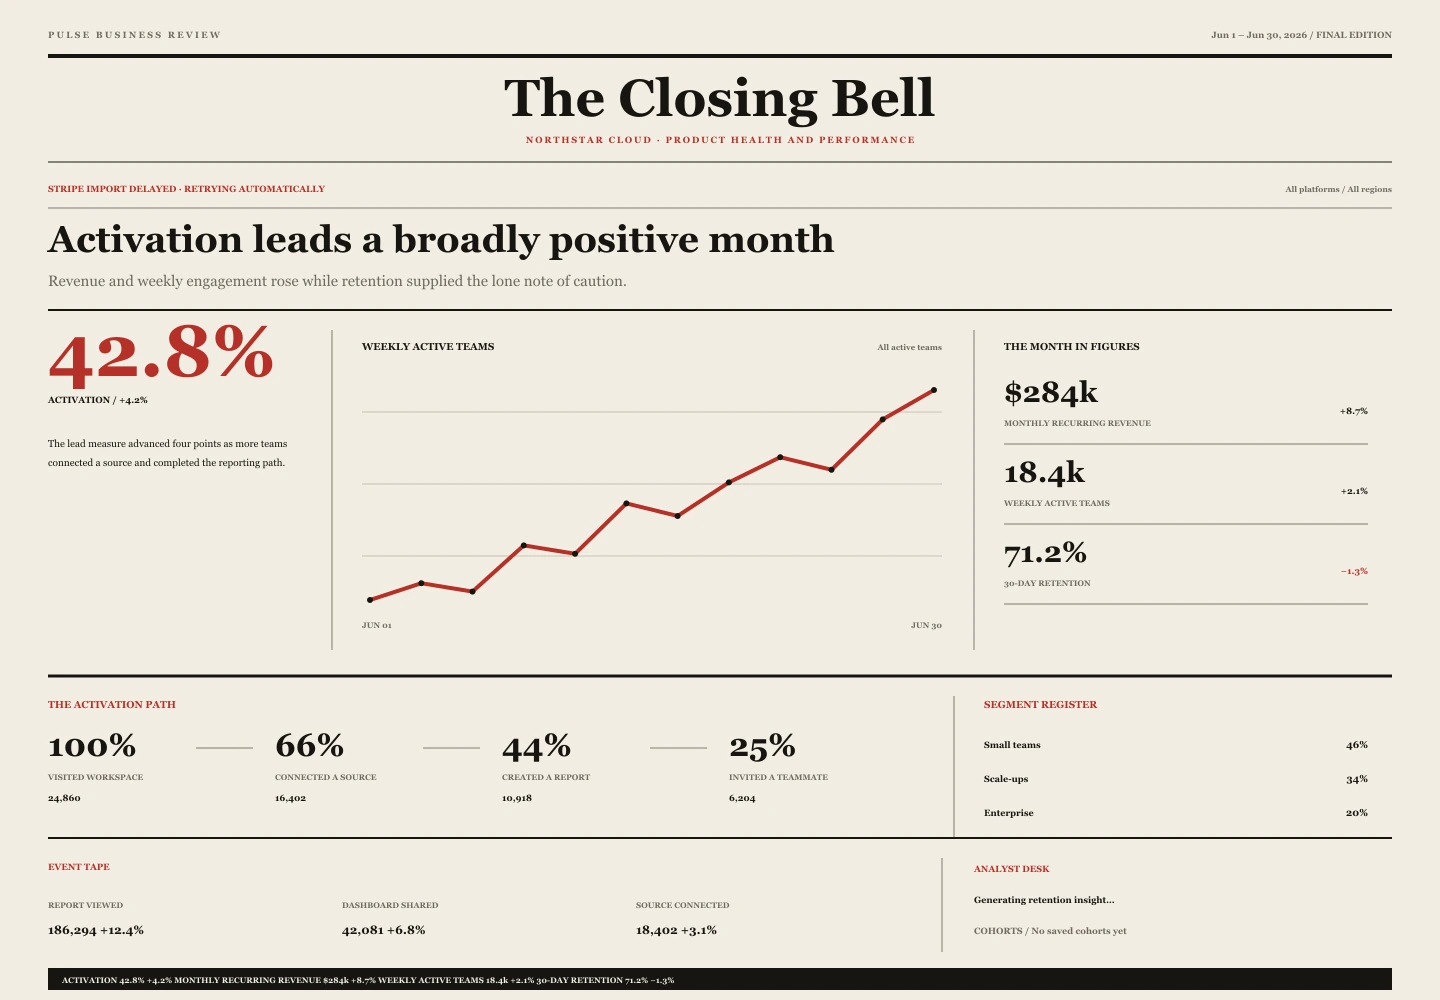
A market-close front page converts the monthly dashboard into a decisive, finite edition.
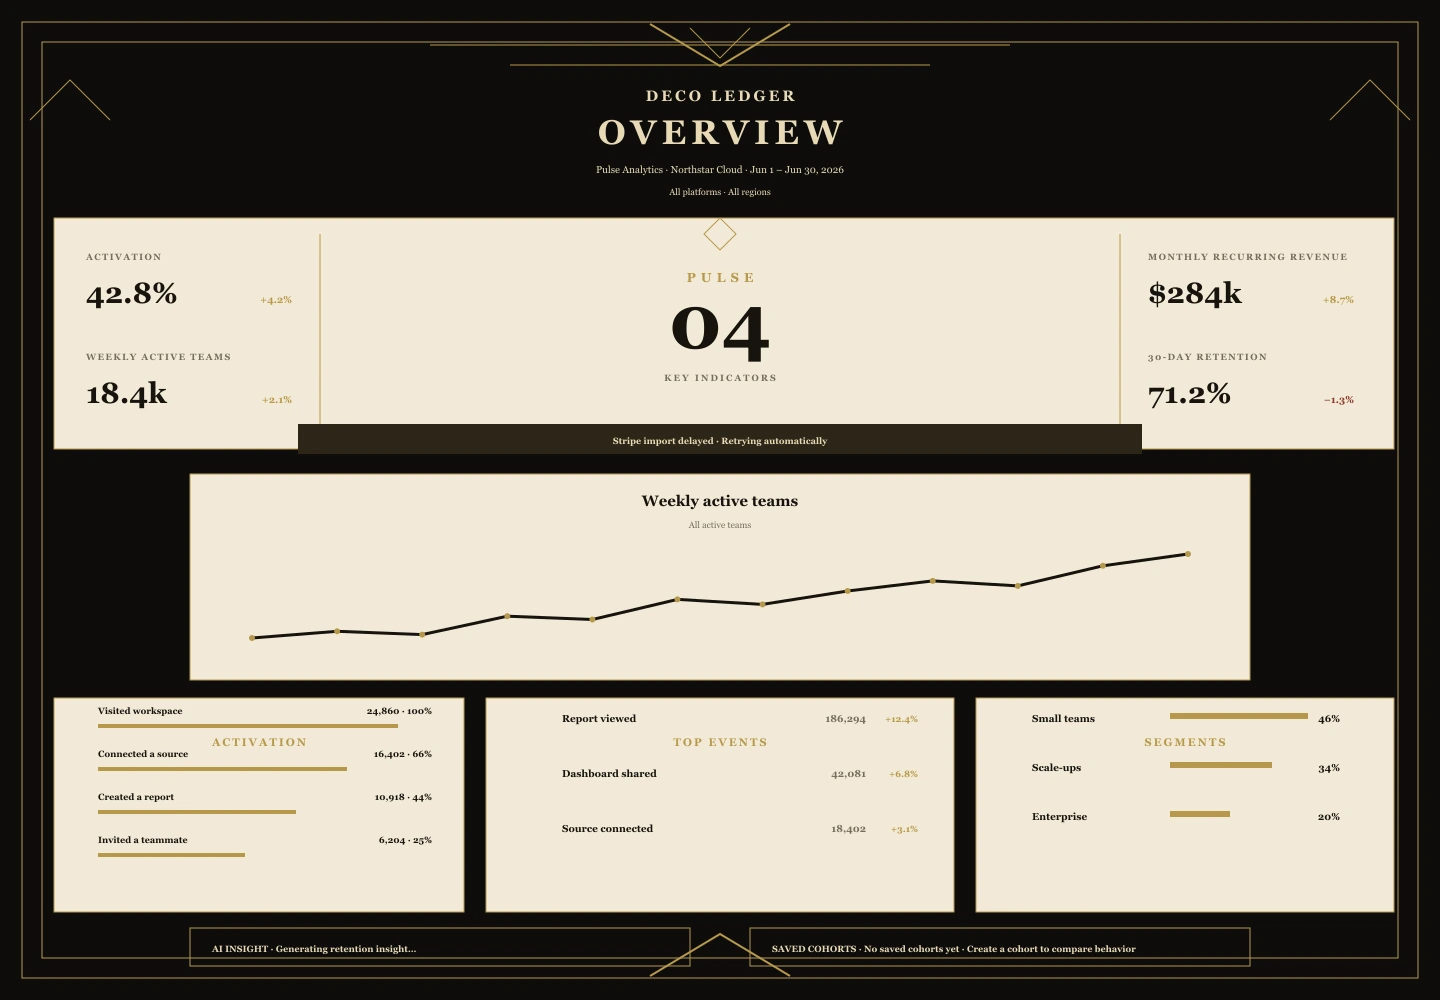
A black, cream, and gold ledger arranges product health with ceremonial symmetry and fine architectural rules.
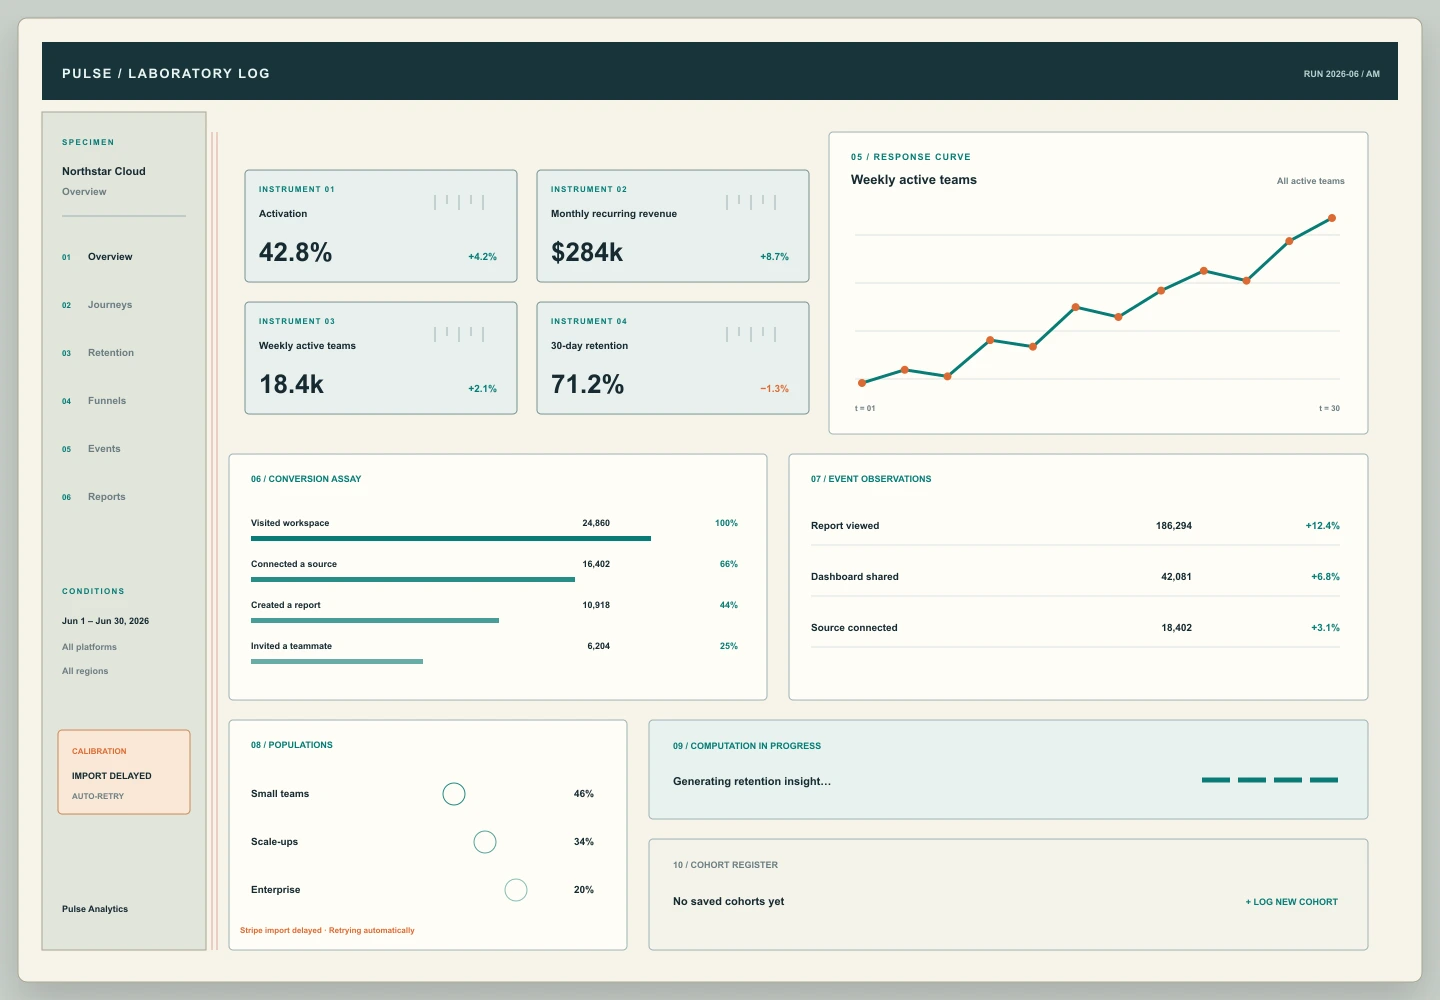
A scientific workbench presents product analytics as measured observations with calibration marks, specimens, and instrument readouts.
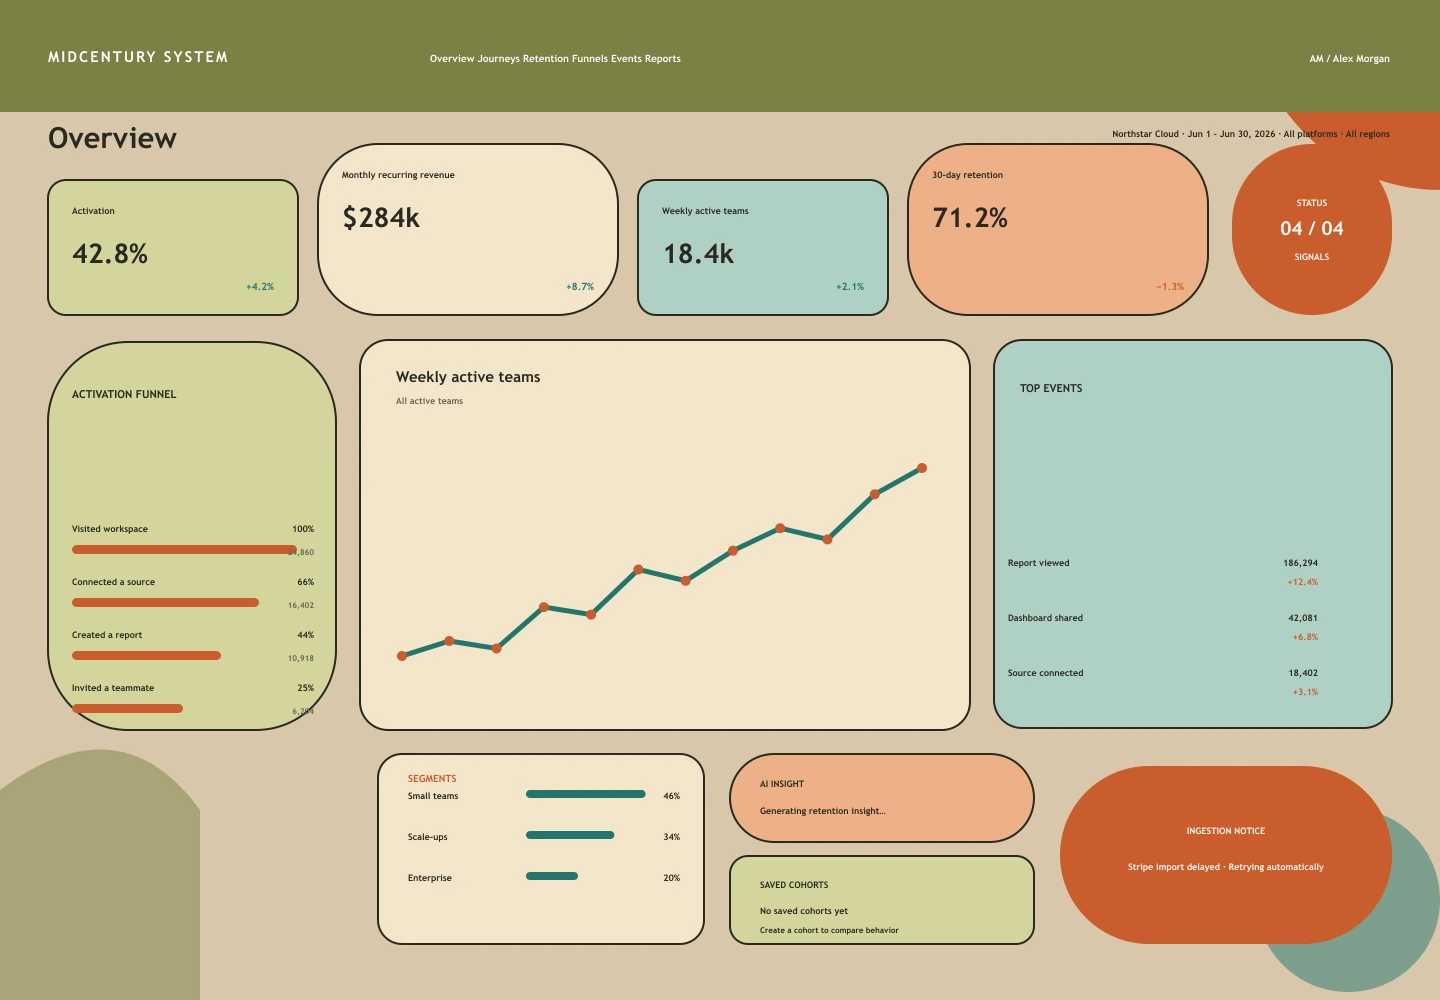
Olive, orange, and teal modules combine cabinet-like order with organic mid-century forms for a warm operational system.
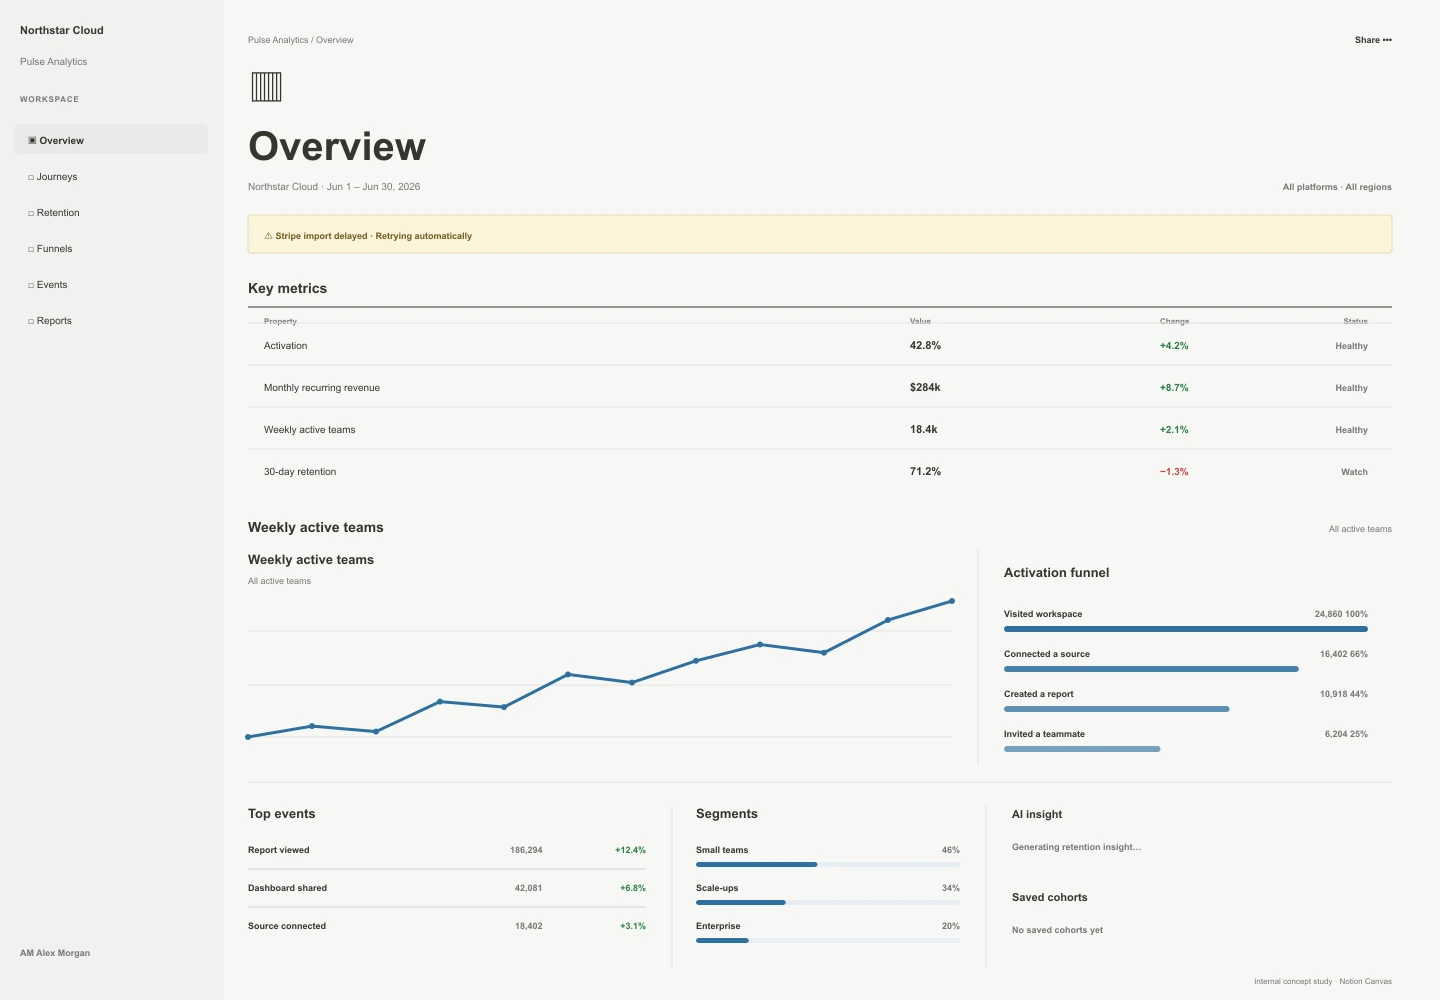
A content-first canvas presents analytics as a living team document with database-like structure.
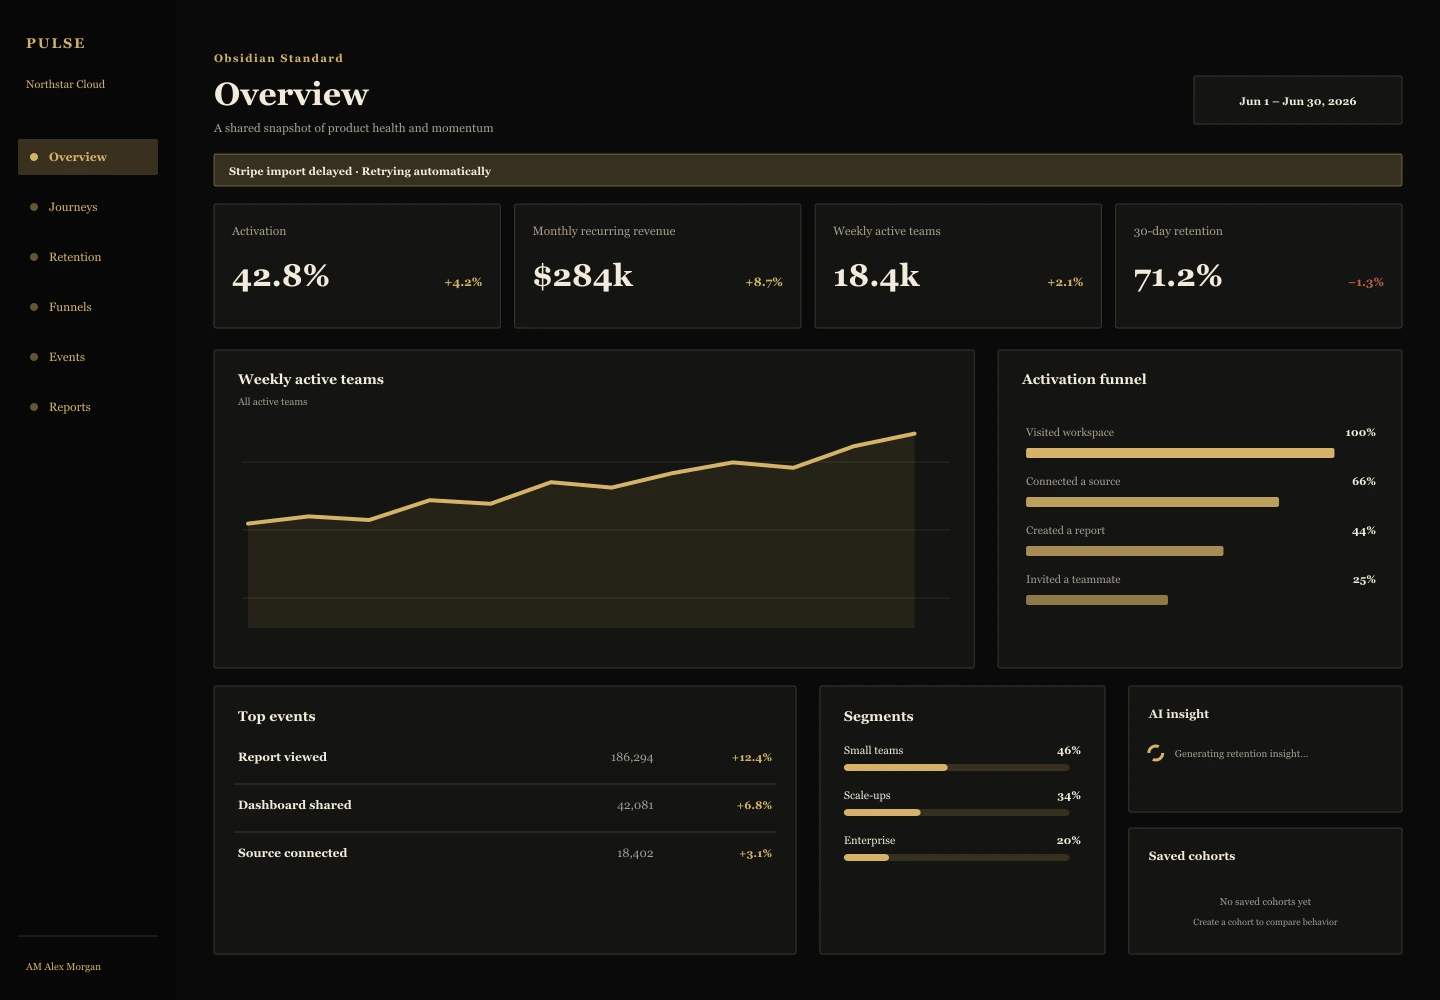
A restrained black-and-gold executive surface that gives recurring metrics the character of a premium instrument.
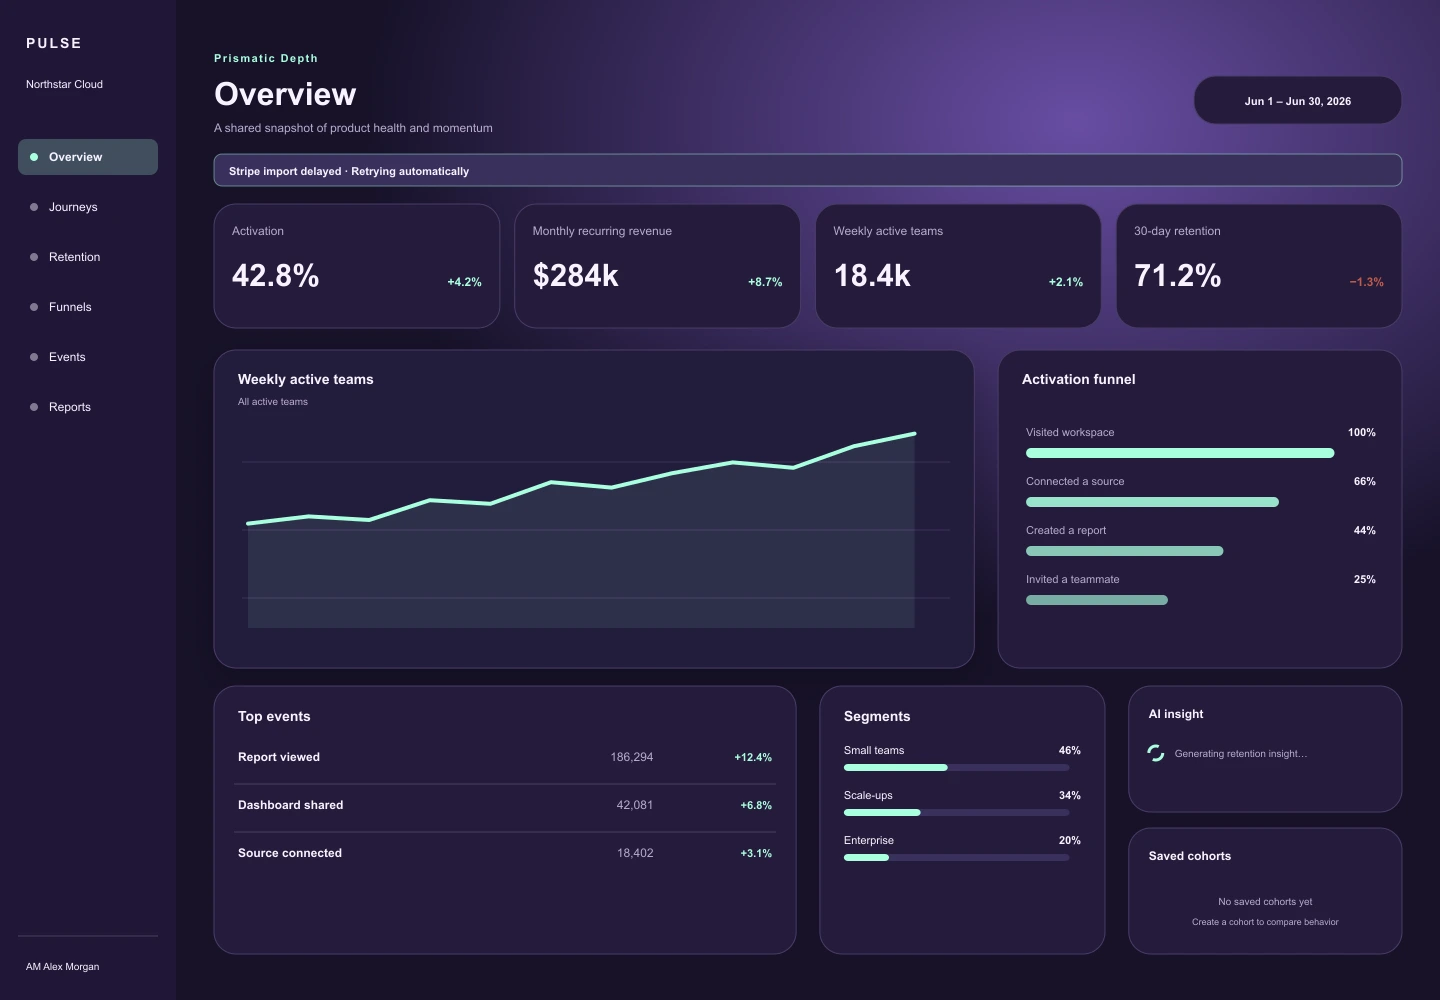
A dimensional dark interface that uses localized glow and translucent layers to frame the analytical surface.
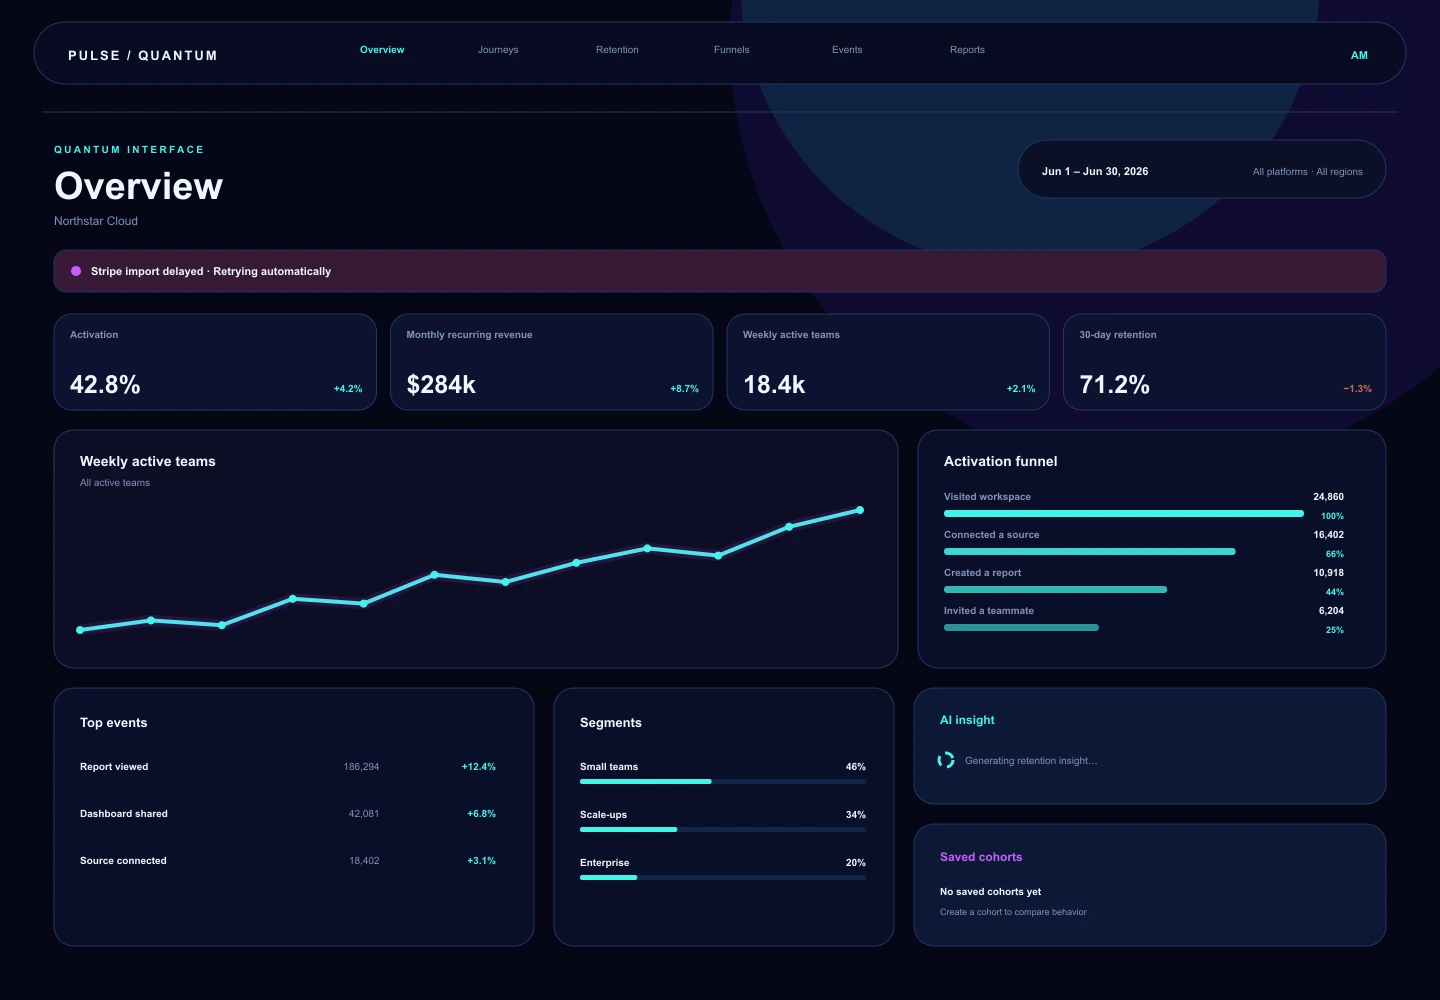
A luminous control surface that turns product analytics into a layered, high-energy operating environment.
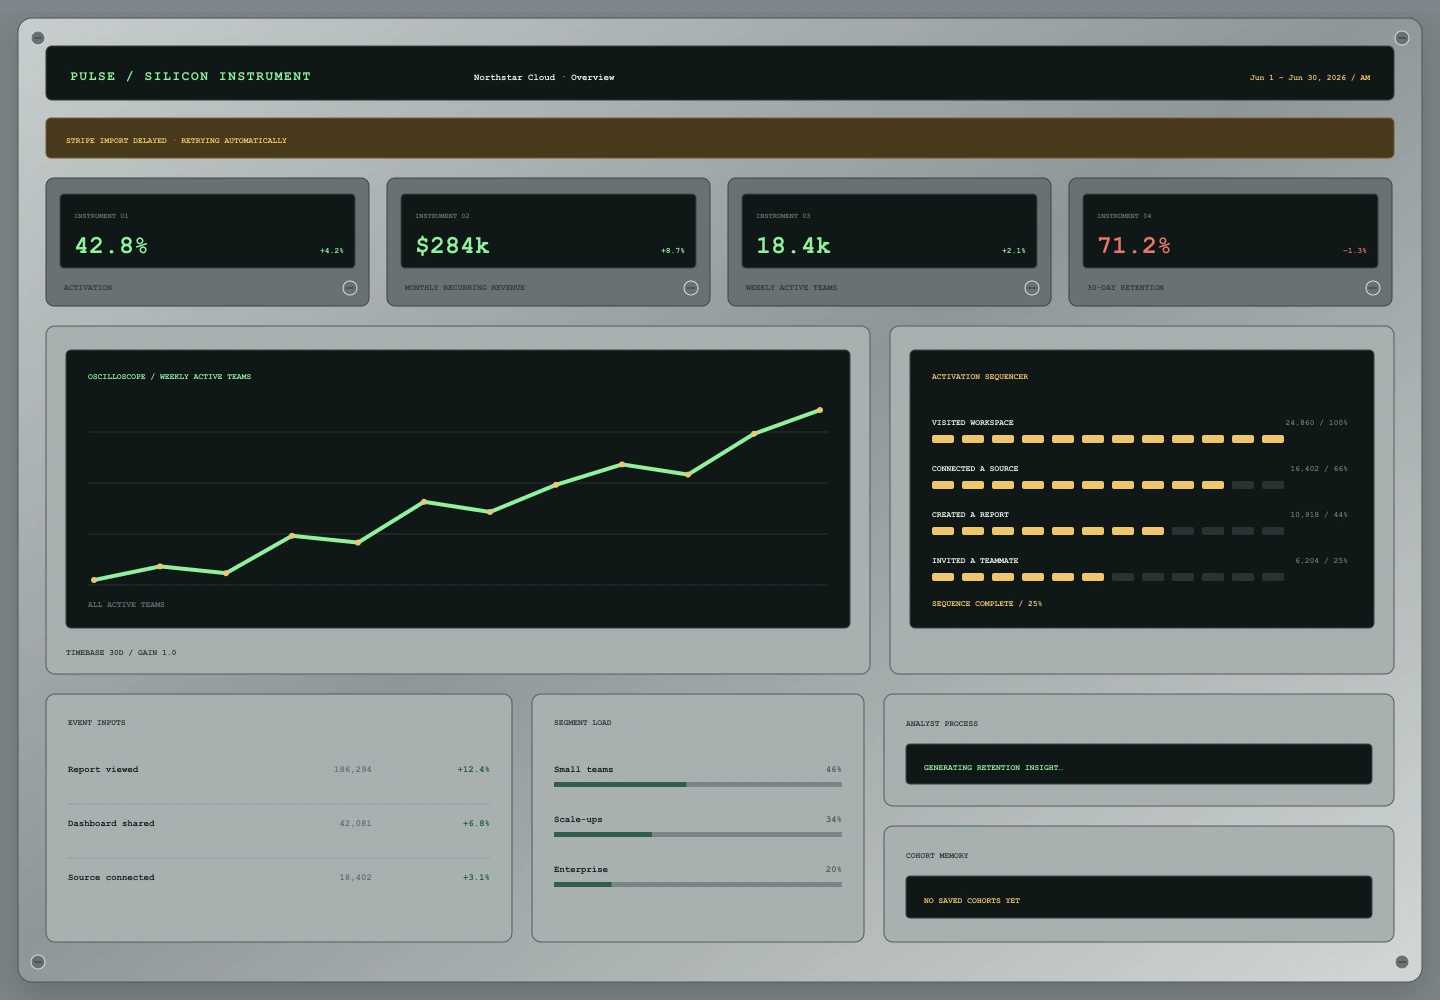
A machined control surface gives the analytics state the physical confidence of laboratory hardware.
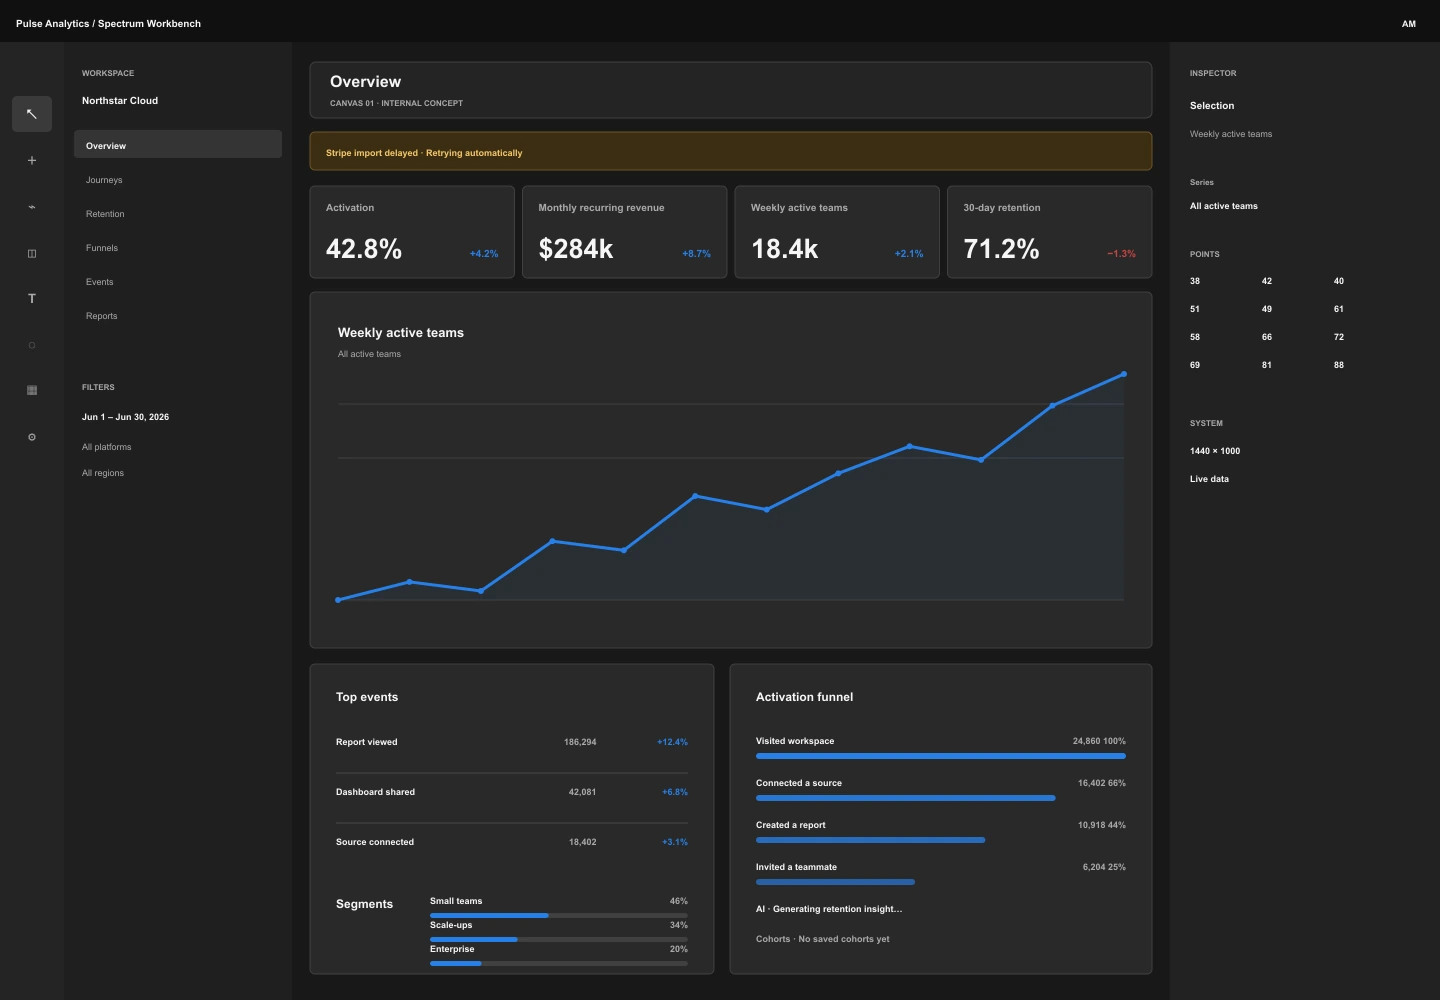
A creative workbench reframes analytics as a canvas surrounded by compact tool and inspector palettes.
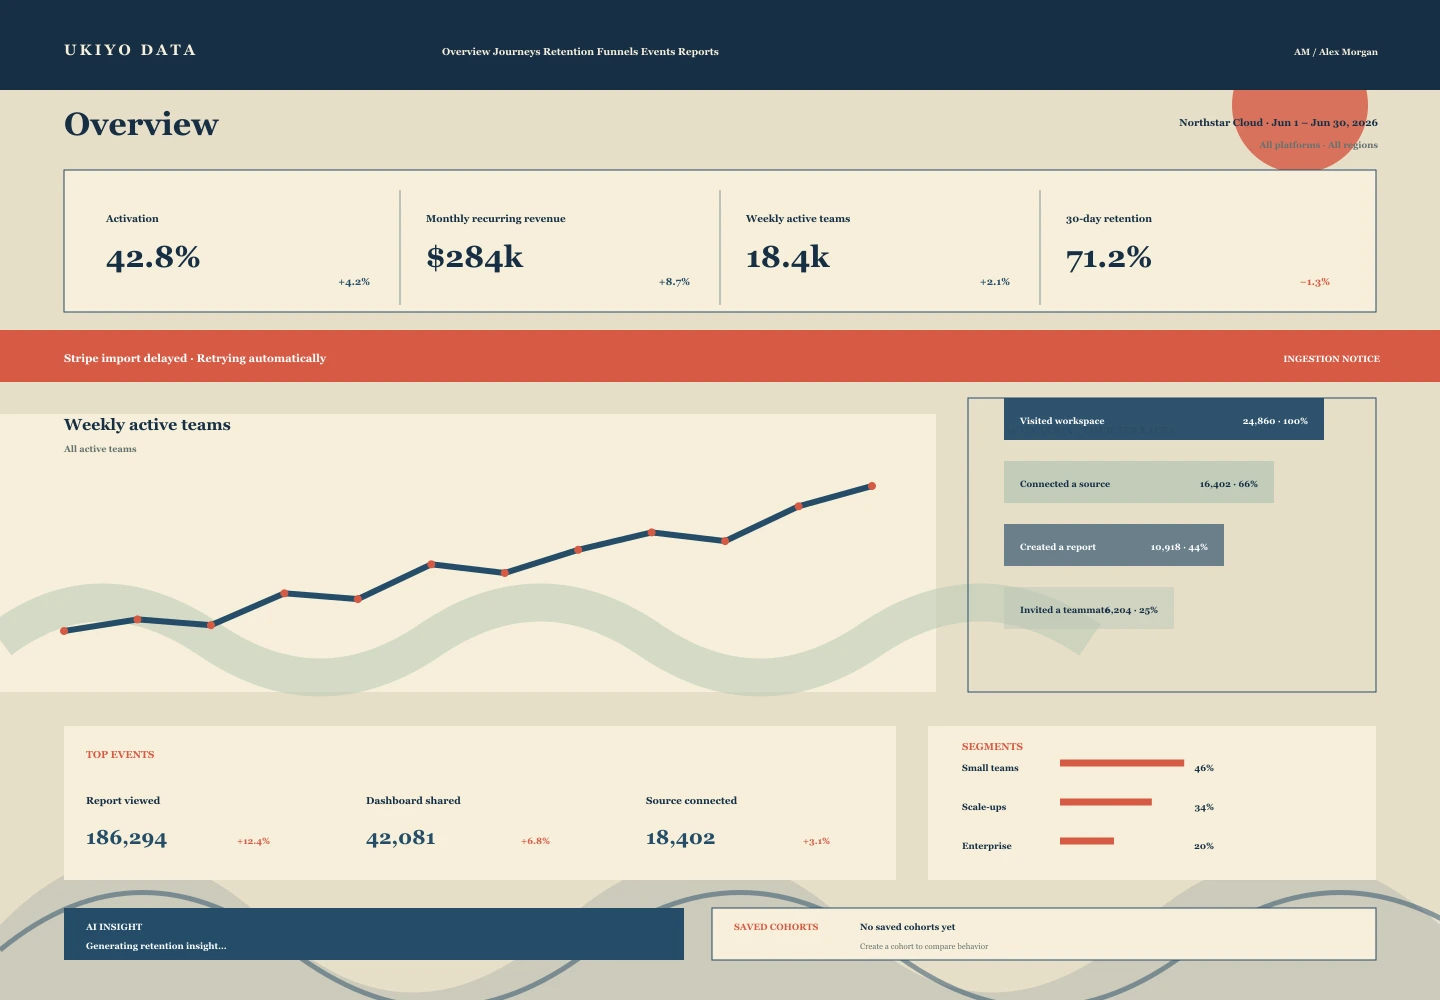
Indigo bands, coral seals, and a wave-like trend composition reinterpret the dashboard as a horizontally layered woodblock-inspired scene.
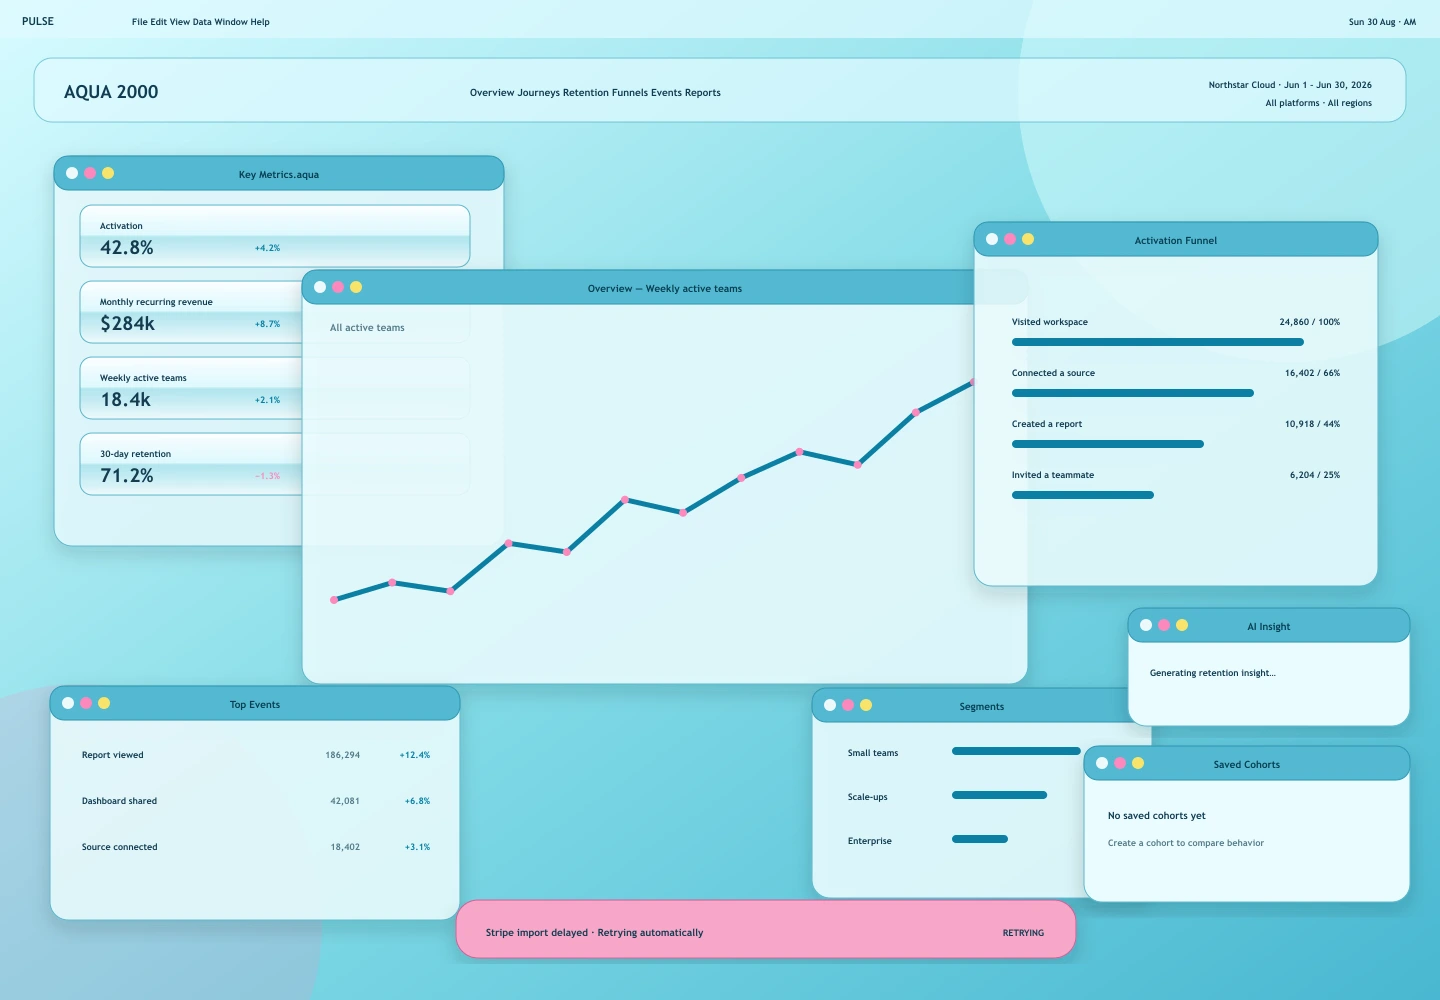
Translucent aqua windows, glossy controls, and desktop chrome recast the analytics workspace as an optimistic turn-of-the-century application.
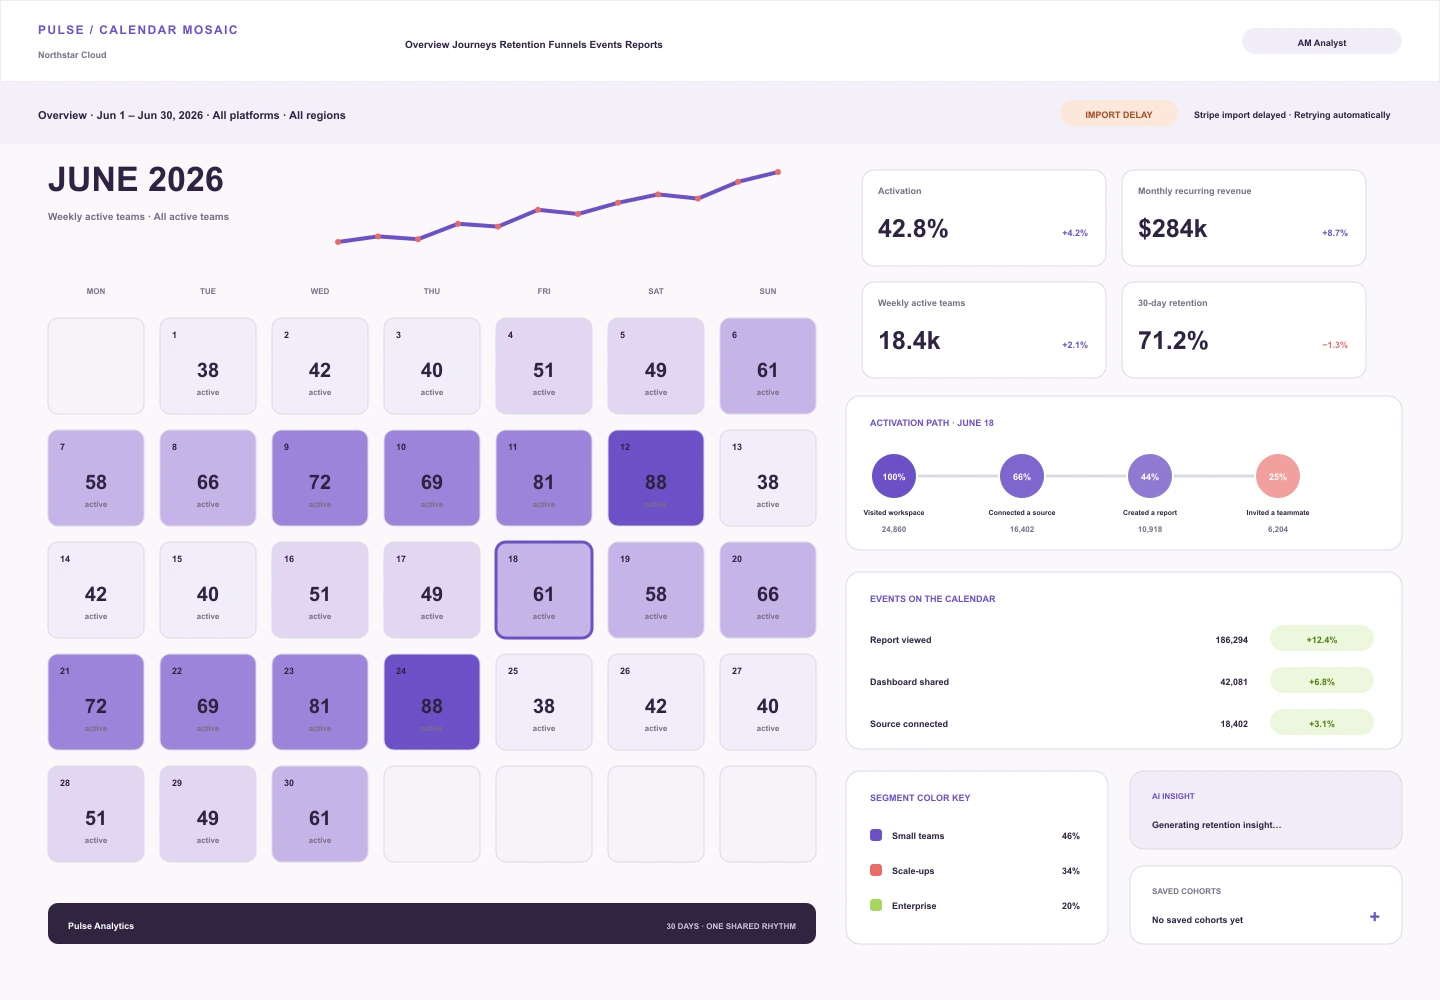
A month-scale mosaic makes time the organizing model, embedding health, momentum, events, and conversion into daily analytical cells.
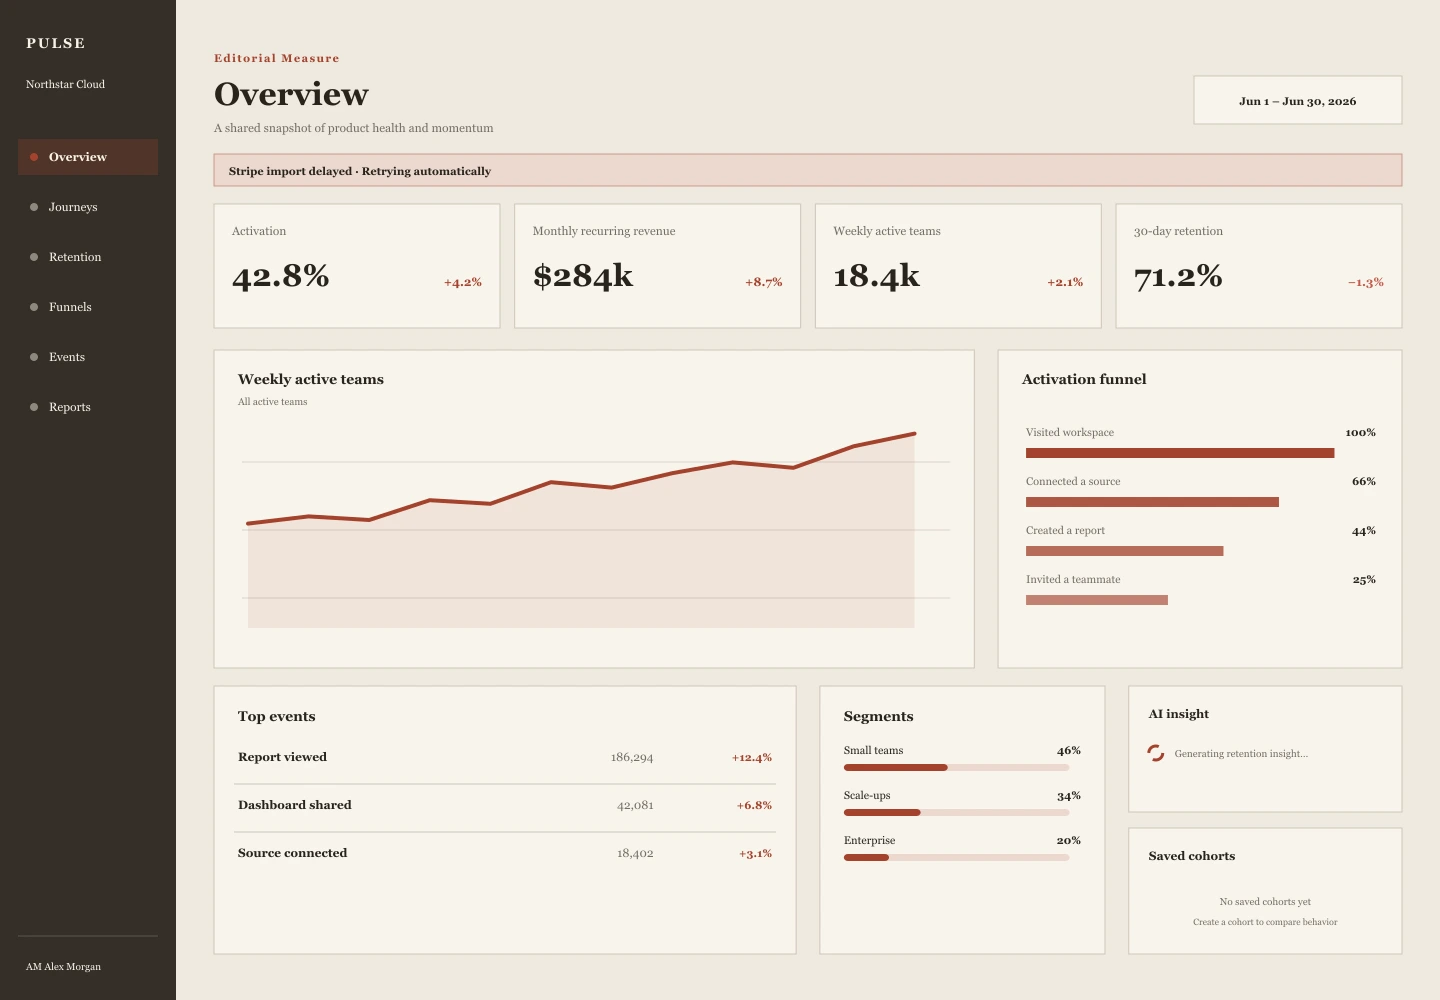
A report-like interpretation that turns product metrics into a composed editorial reading experience.
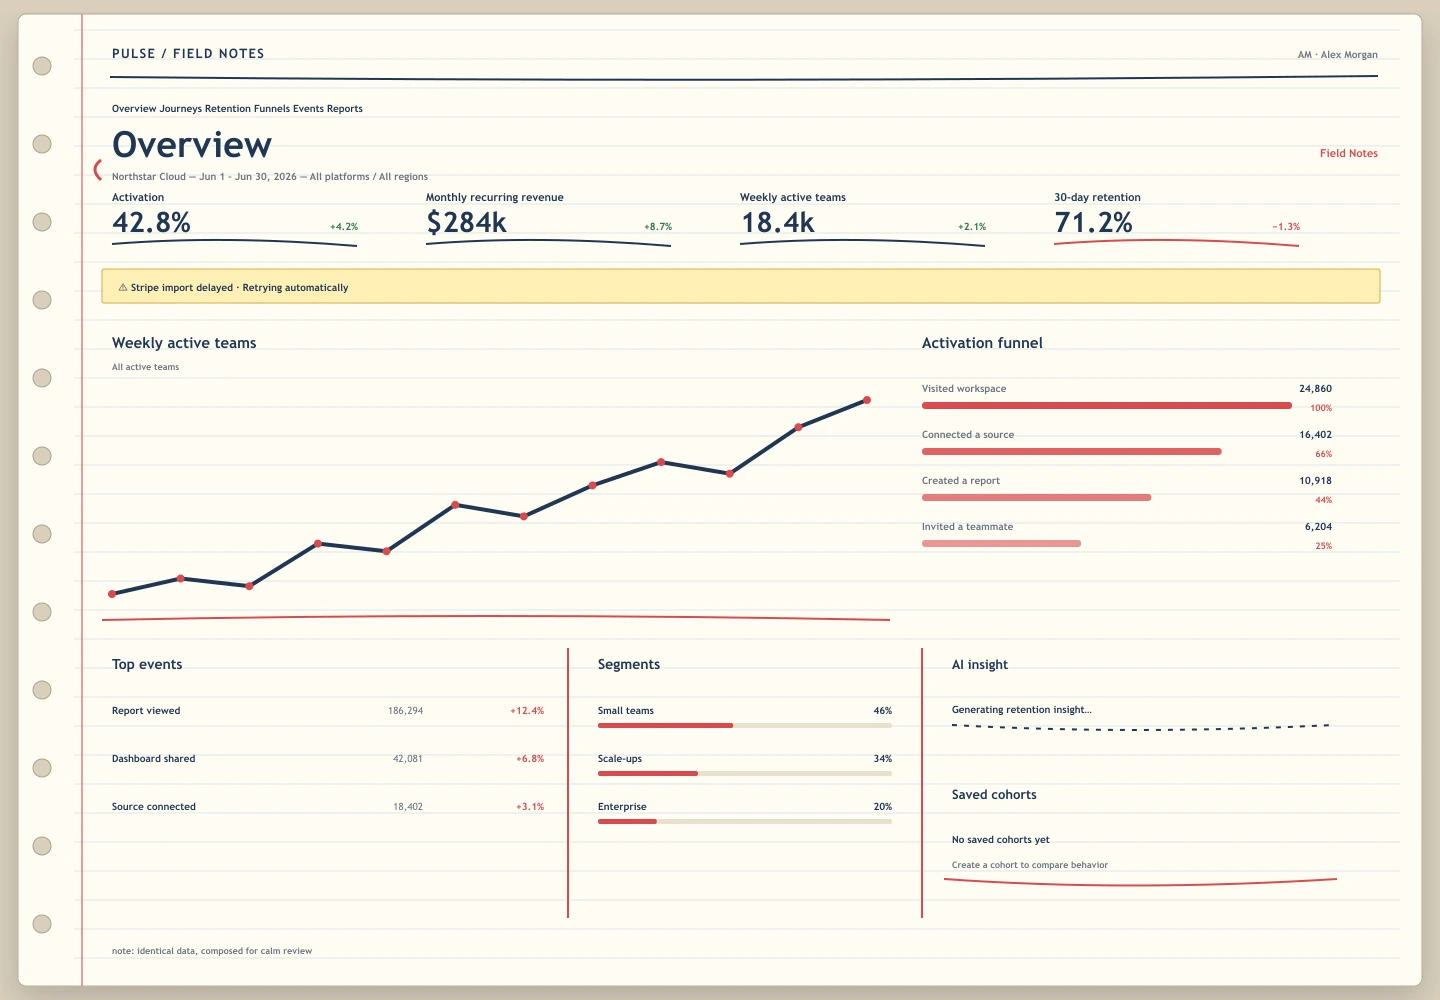
A notebook-like analytics surface feels observed, annotated, and ready for collaborative interpretation.
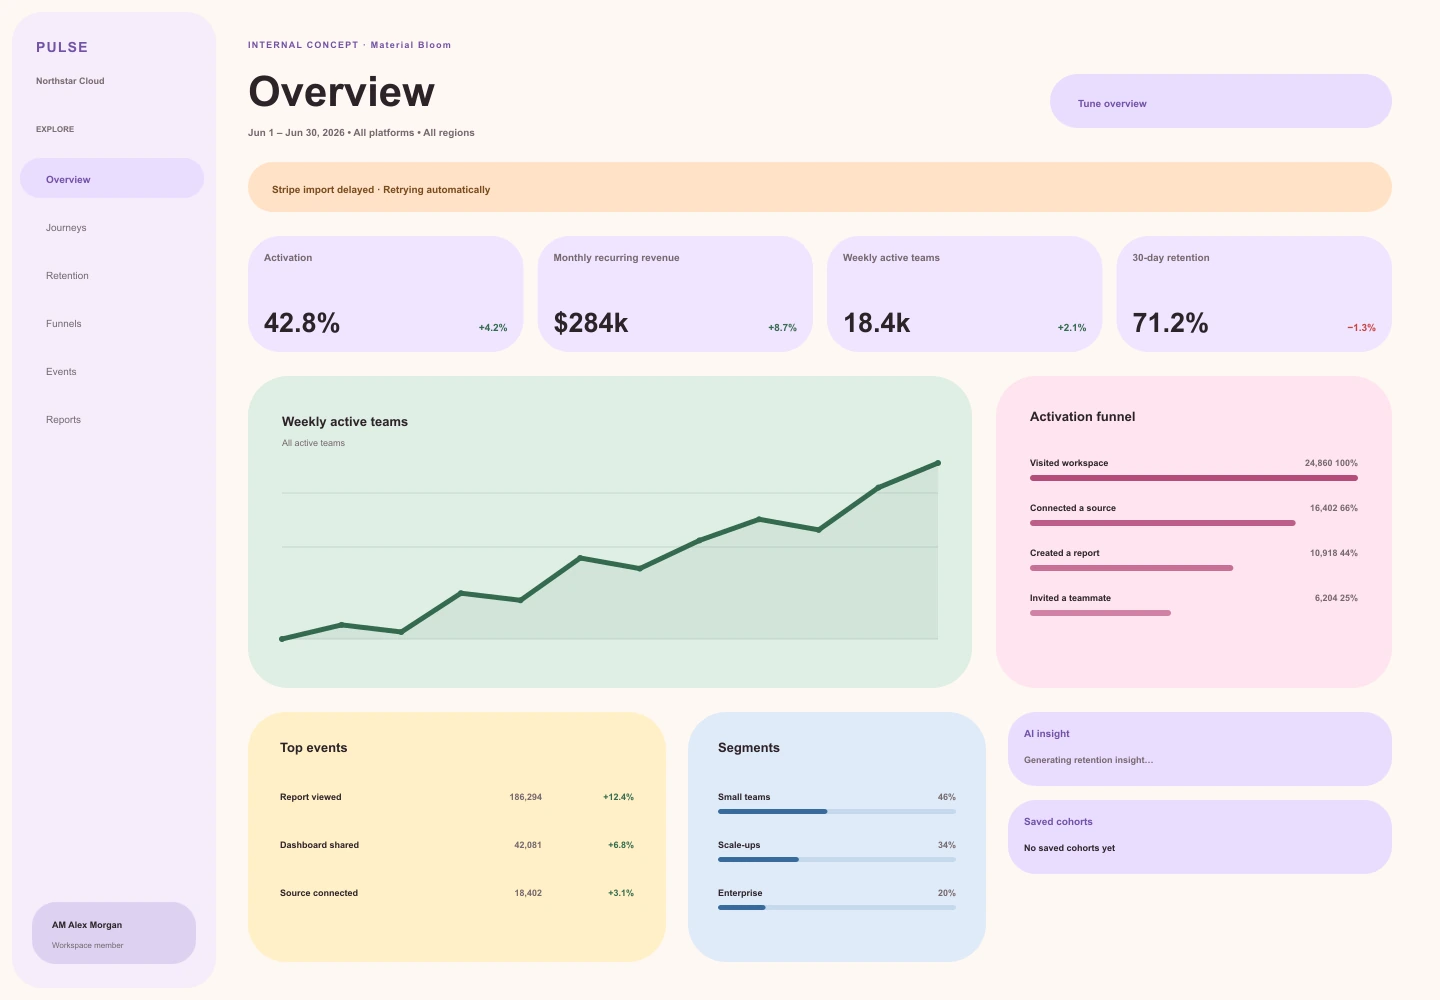
An expressive pastel system uses dynamic shapes and generous rounding to make analytics feel approachable.
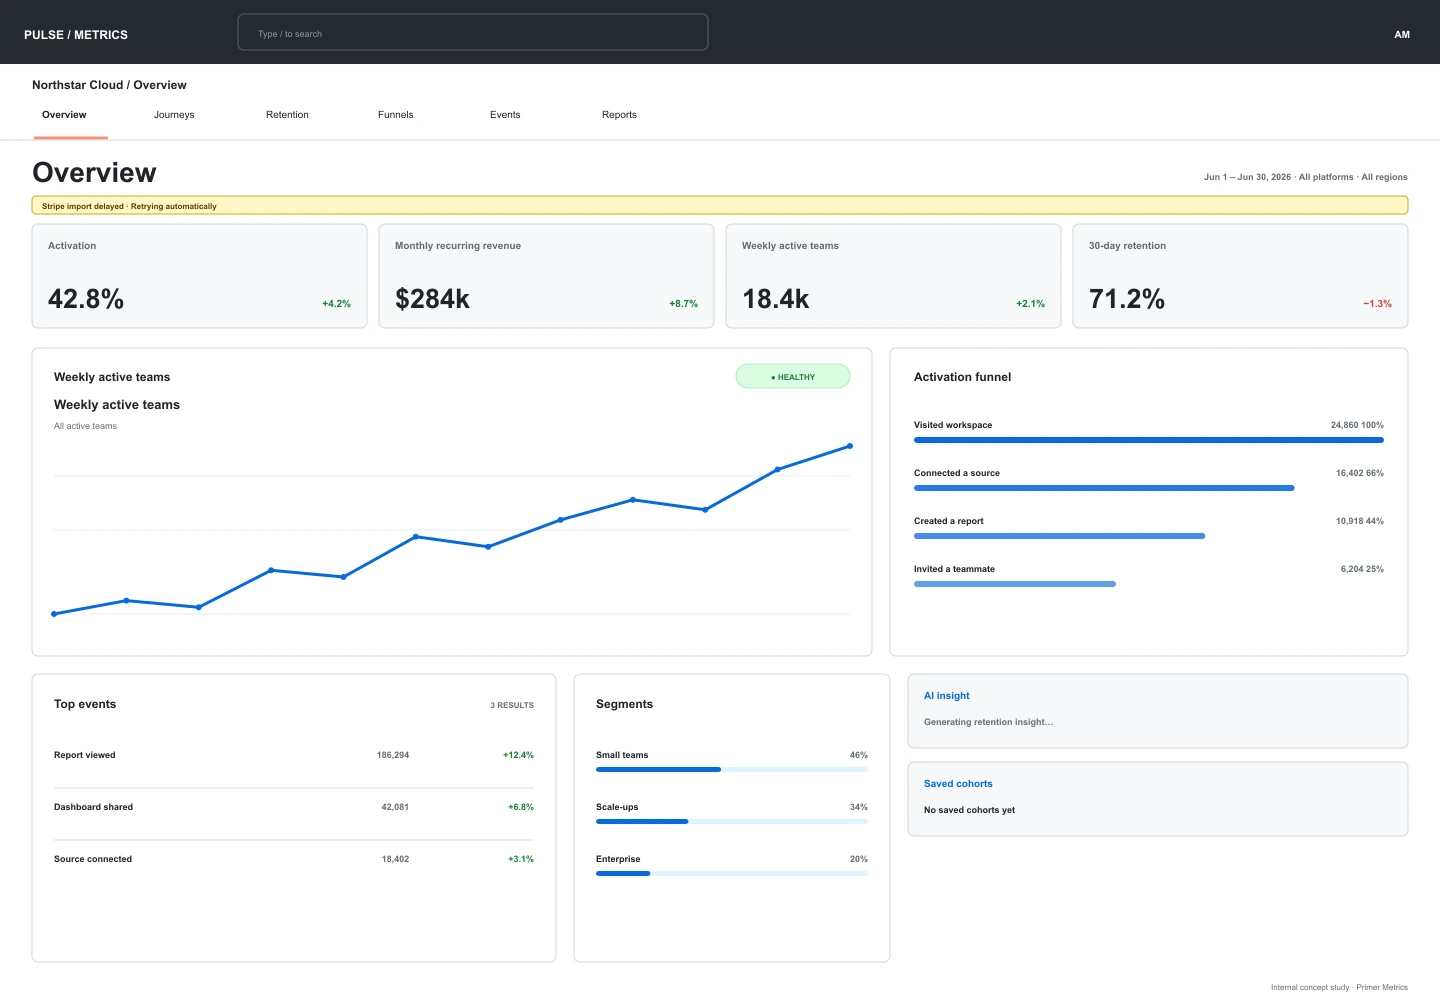
A repository-inspired metrics study organizes product health through tabs, status labels, and compact monospace values.
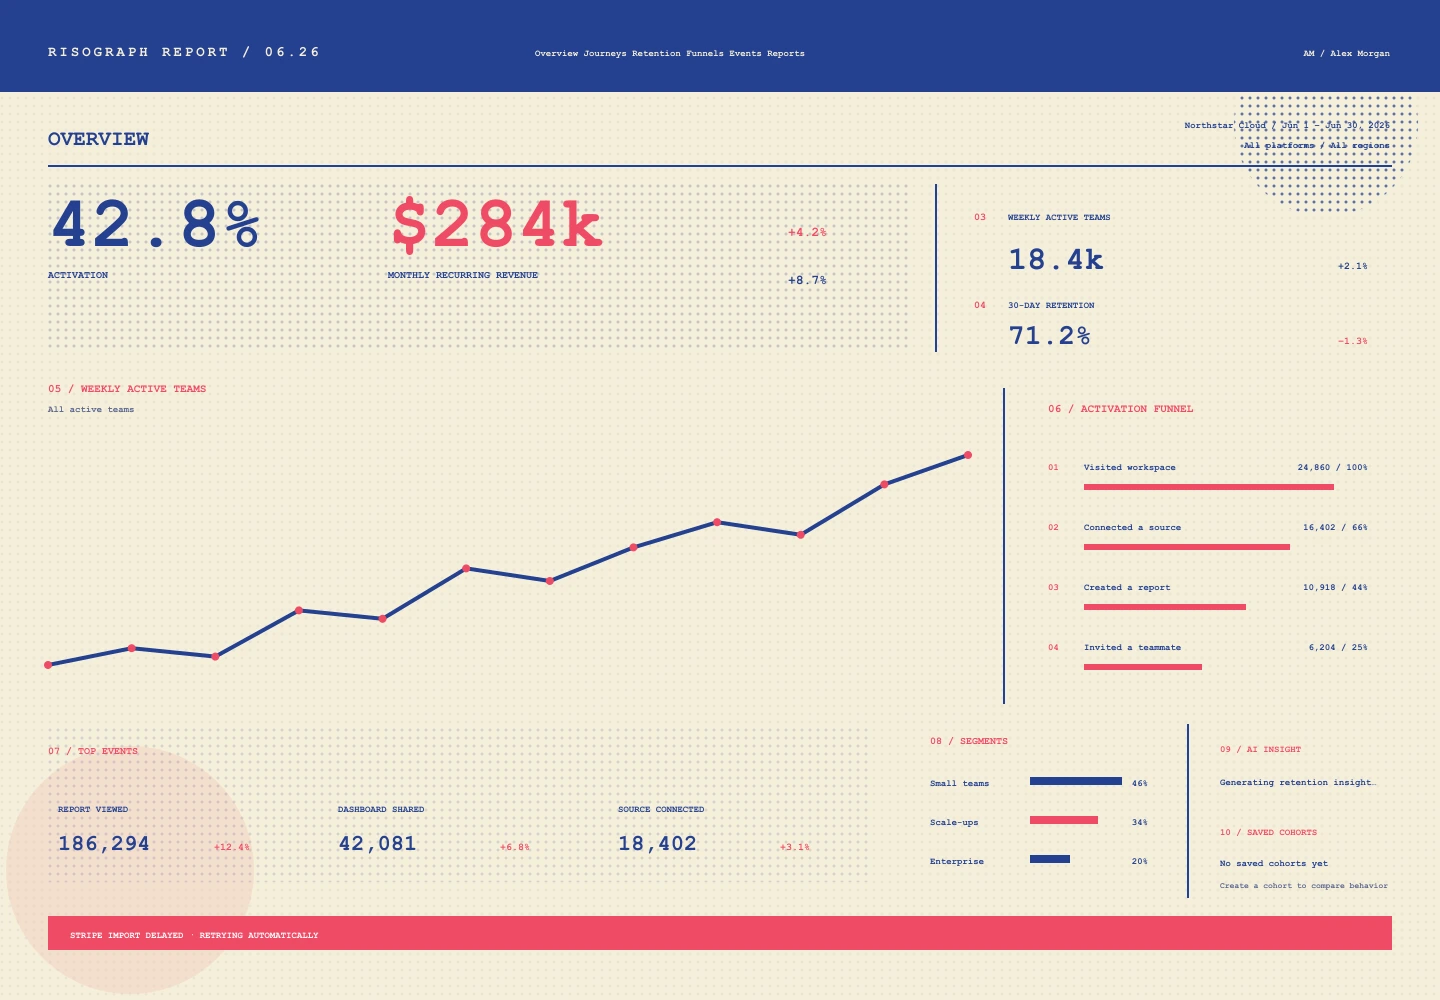
A duotone print study uses halftone fields and imperfect-looking ink layers to make recurring analytics feel authored and tangible.
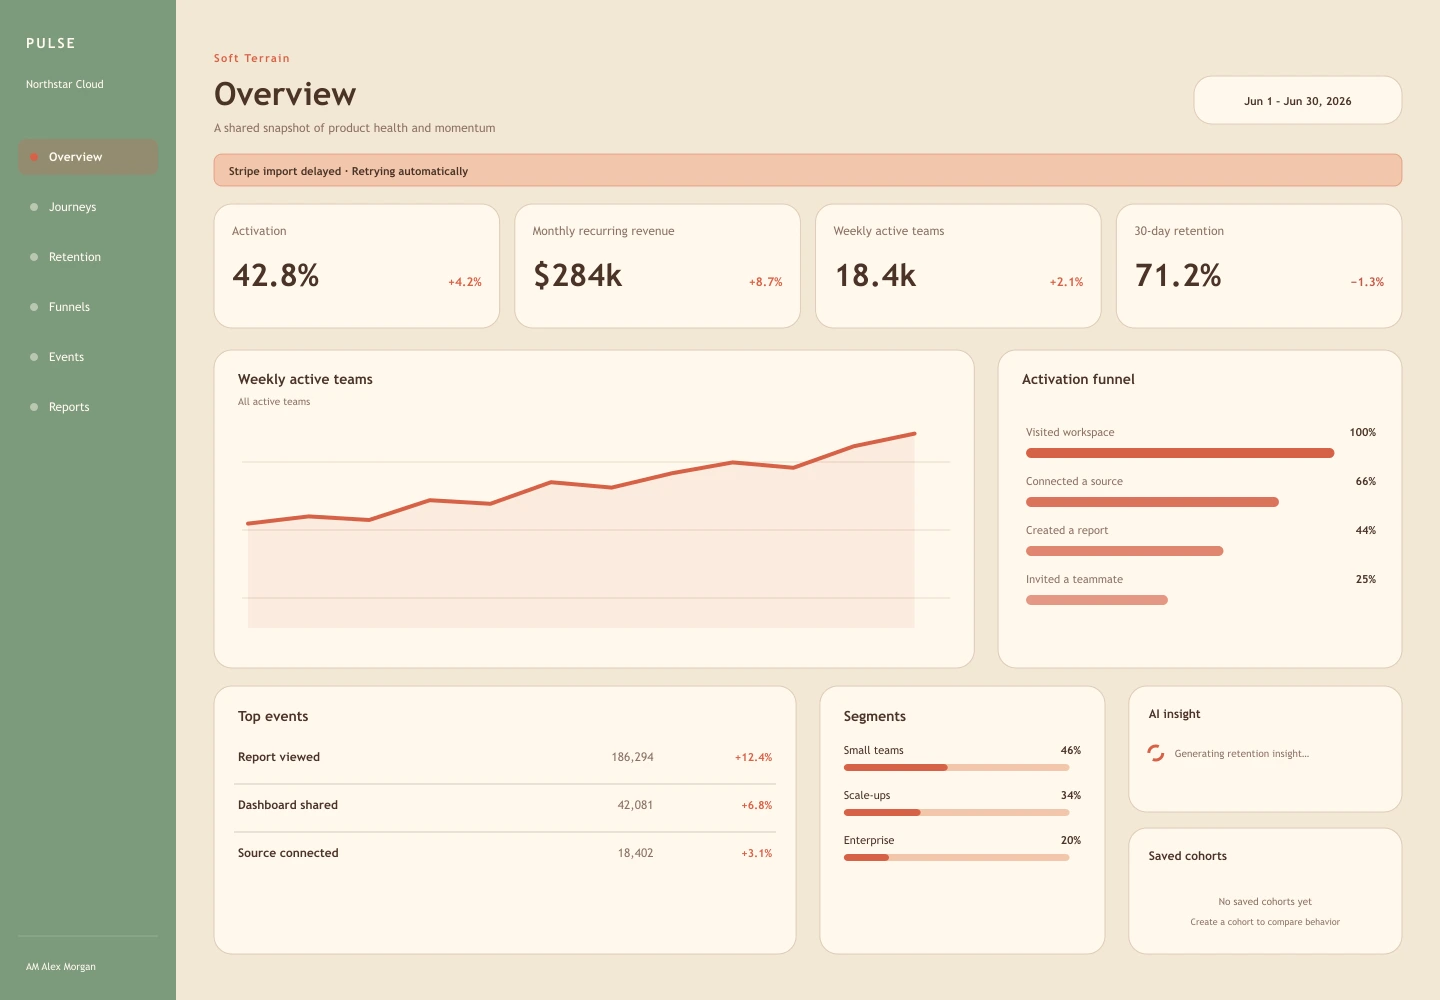
An earthy, approachable workspace that softens analytical complexity without becoming childish.
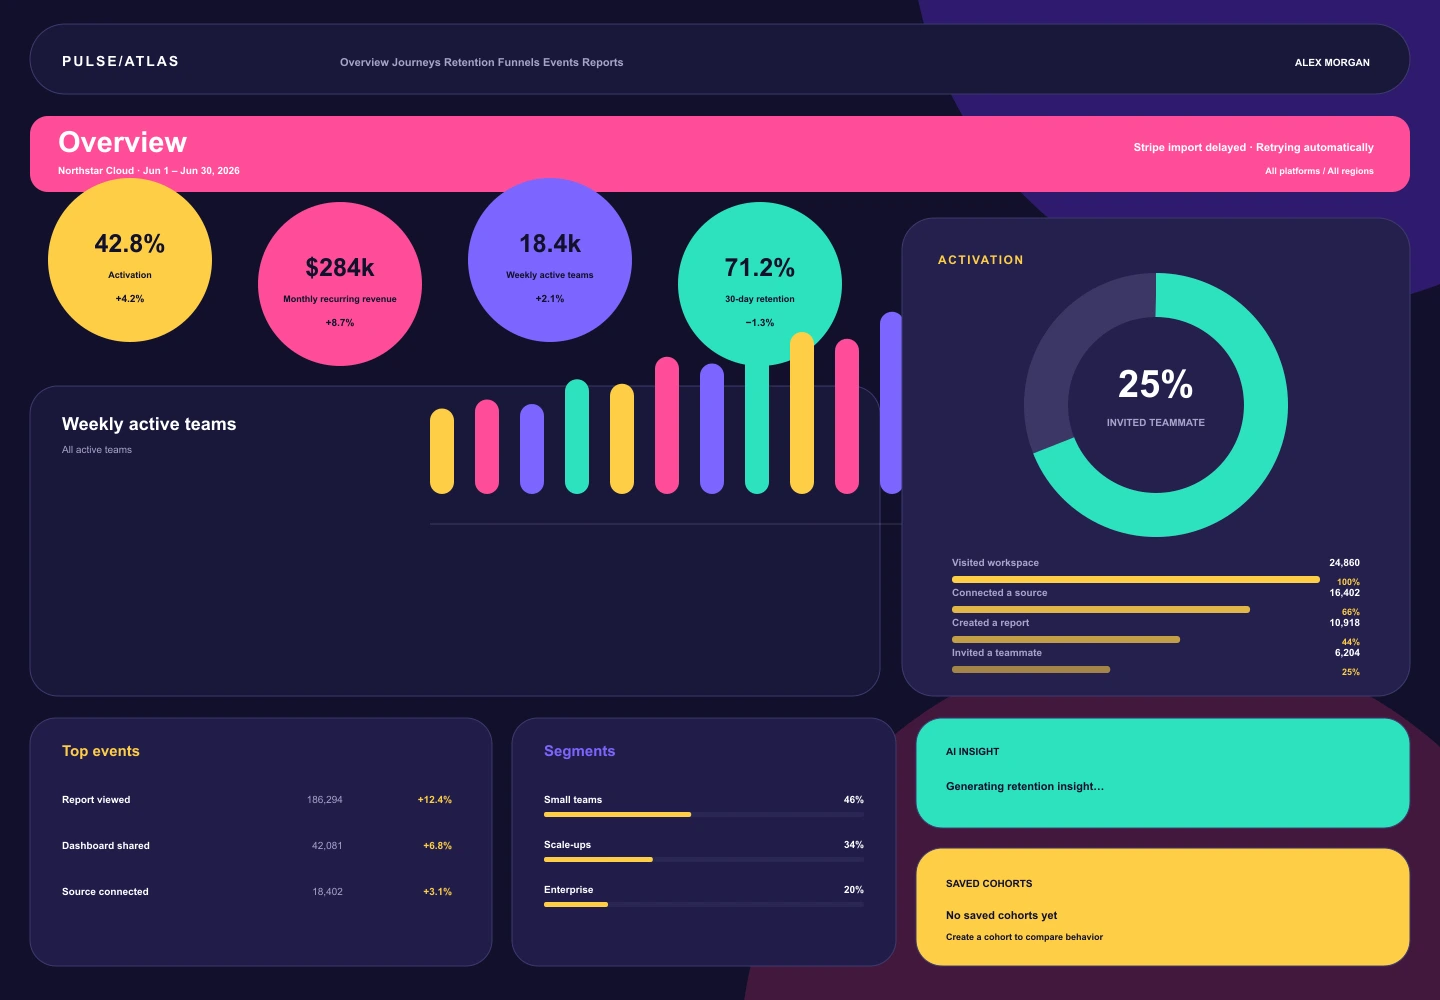
A data-viz maximalist study turns each performance signal into a vivid, individually recognizable object.
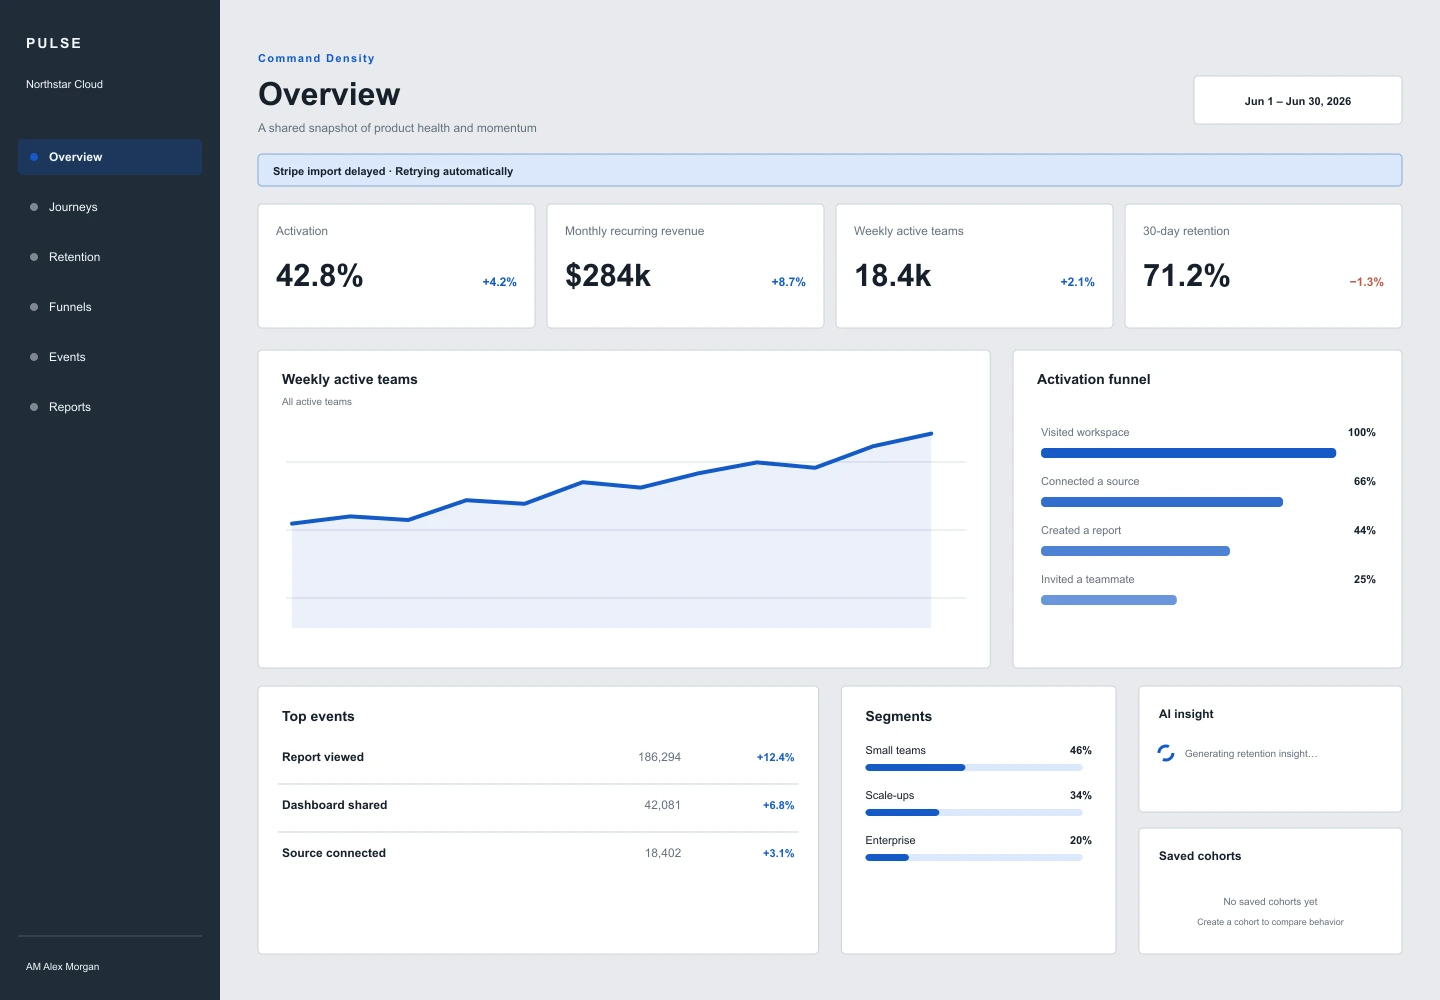
An information-dense enterprise treatment optimized for repeated scanning and operational familiarity.
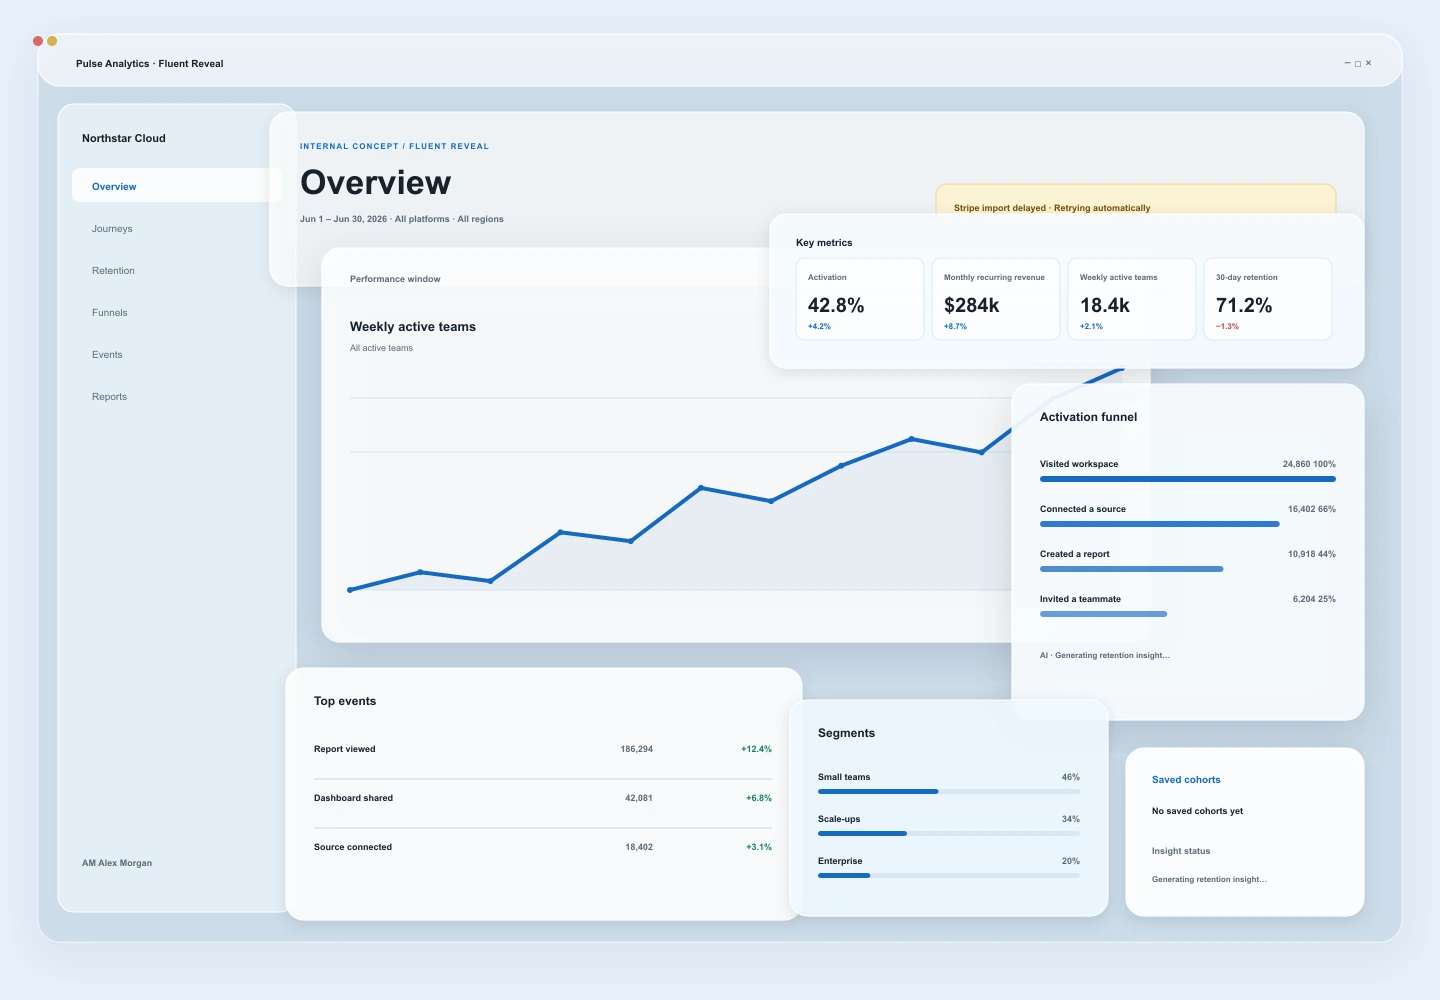
A layered window study combines frosted blue surfaces with a quiet command bar and clear panes.
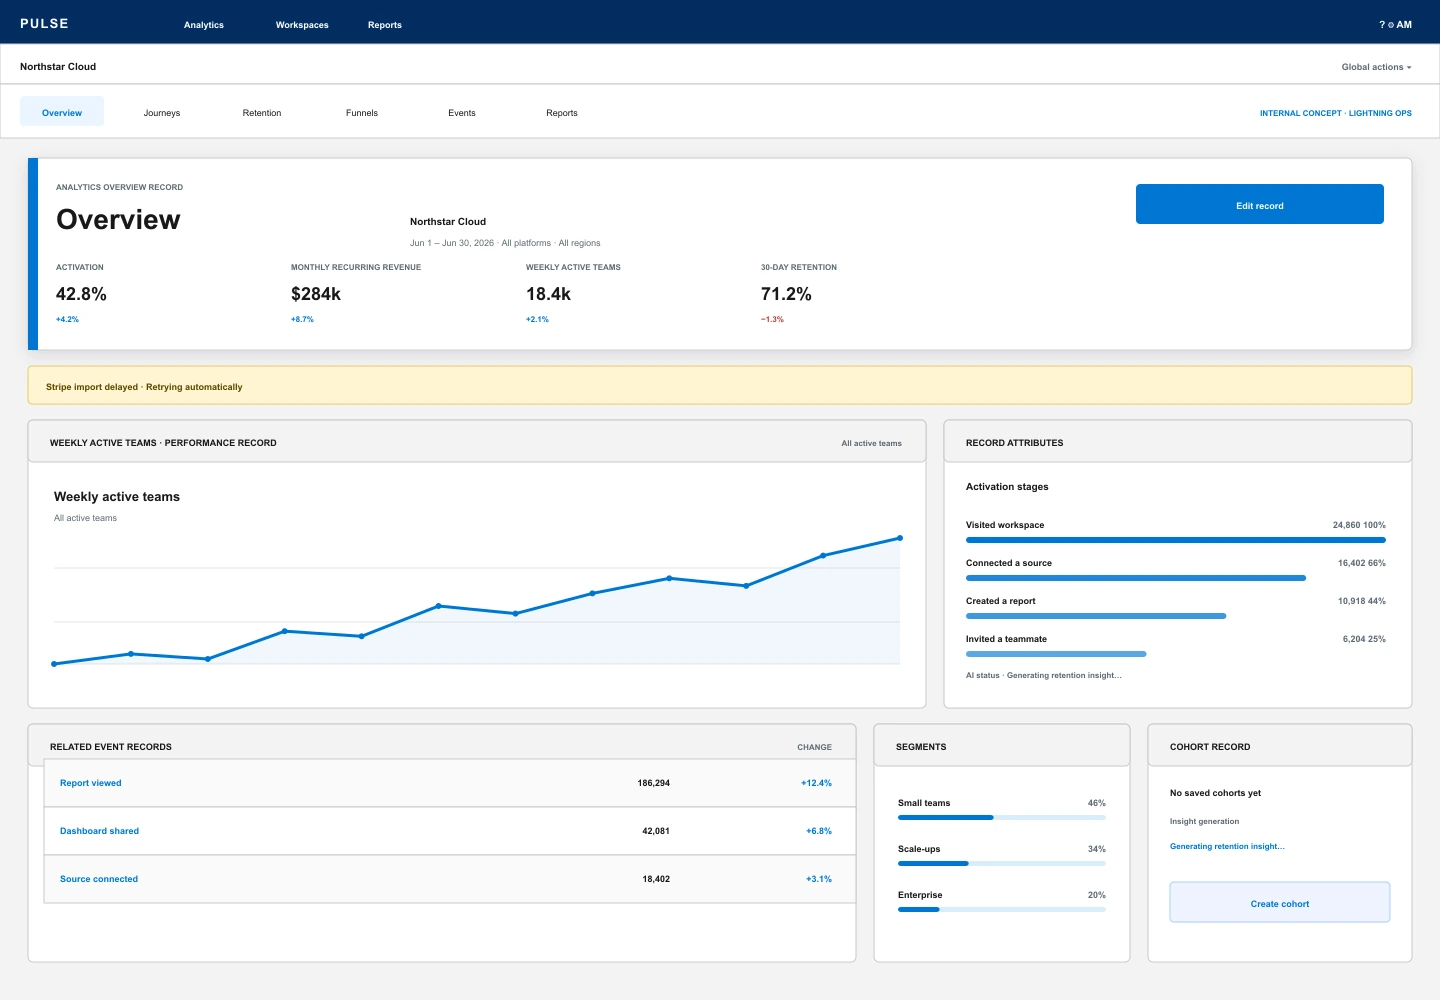
A blue enterprise operations study combines a global utility bar with orderly record-like analytics cards.
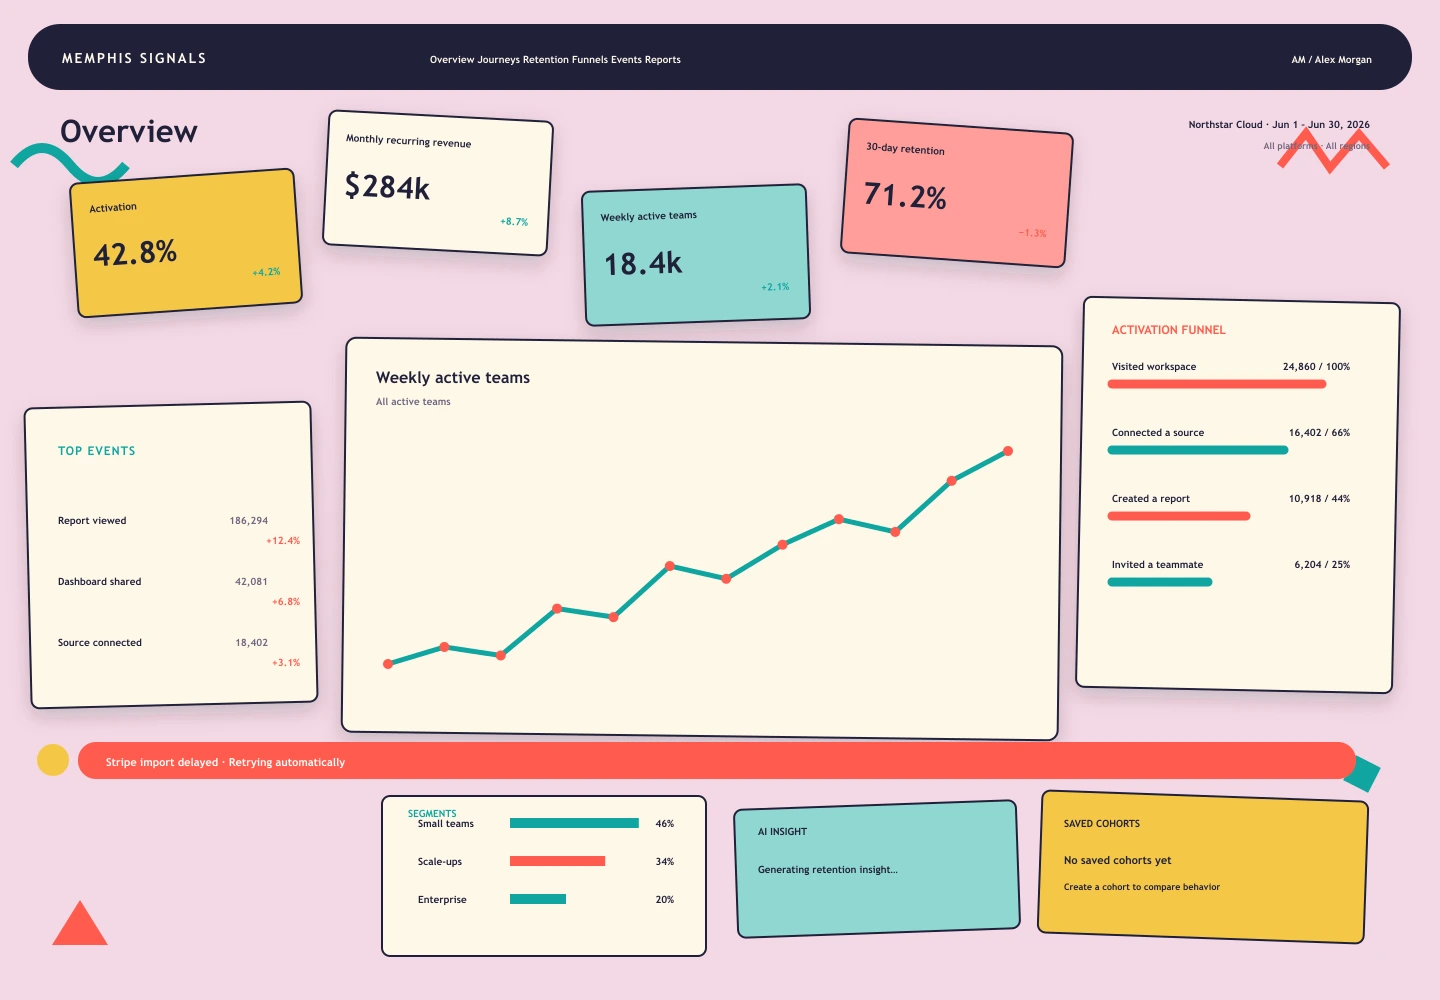
A playful postmodern dashboard balances confetti-like marks, offset cards, and candy colors with a stable analytical backbone.
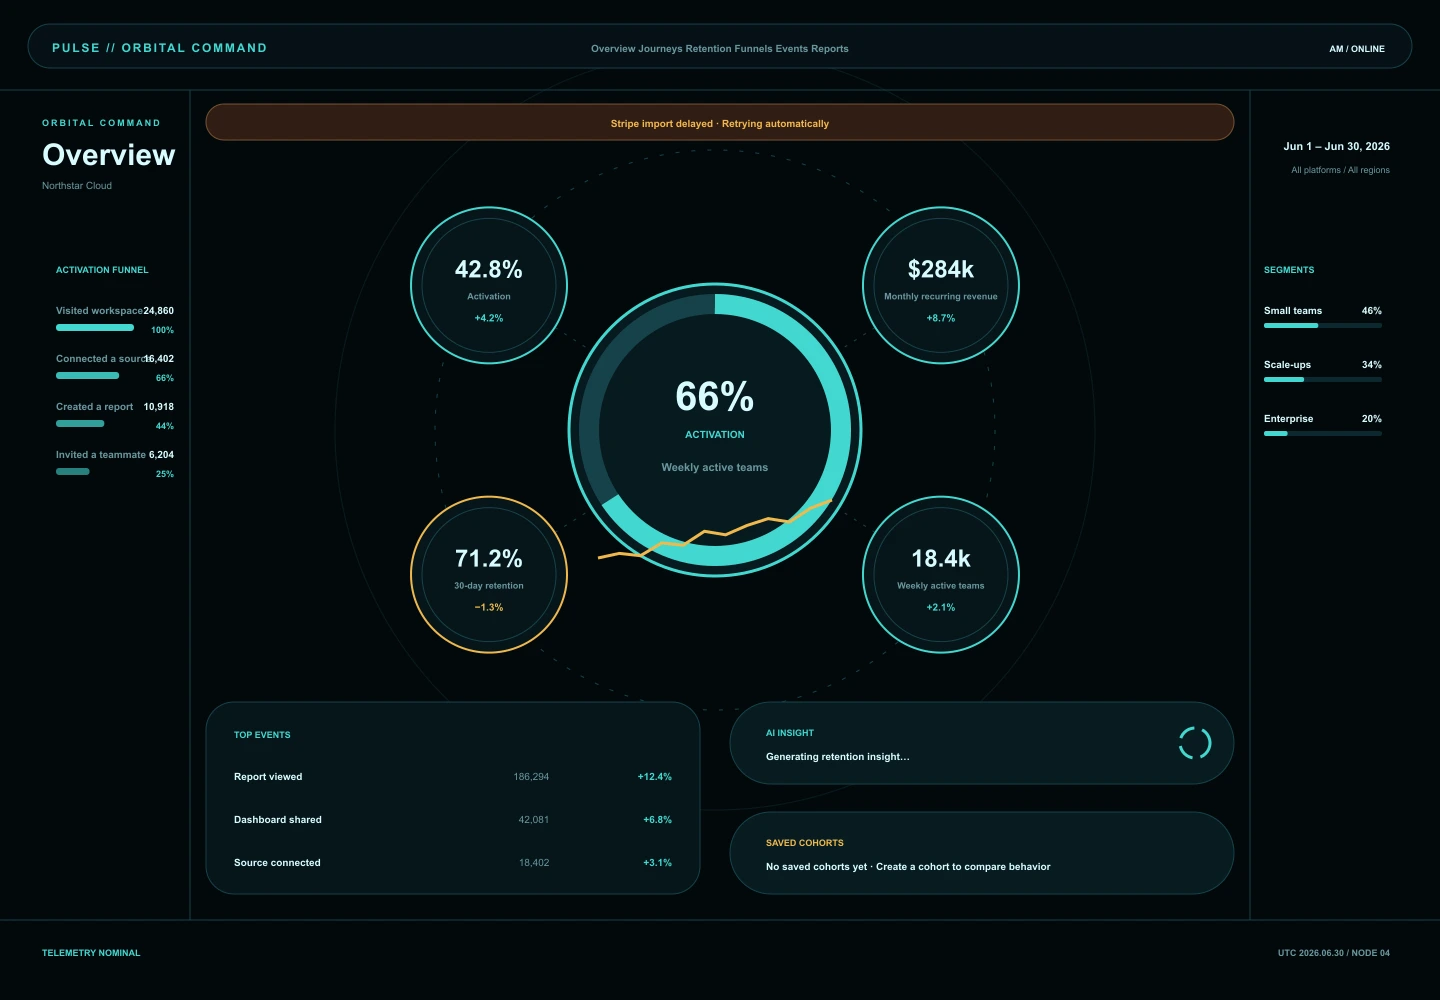
A spatial command center arranges supporting metrics as telemetry around one central activation signal.
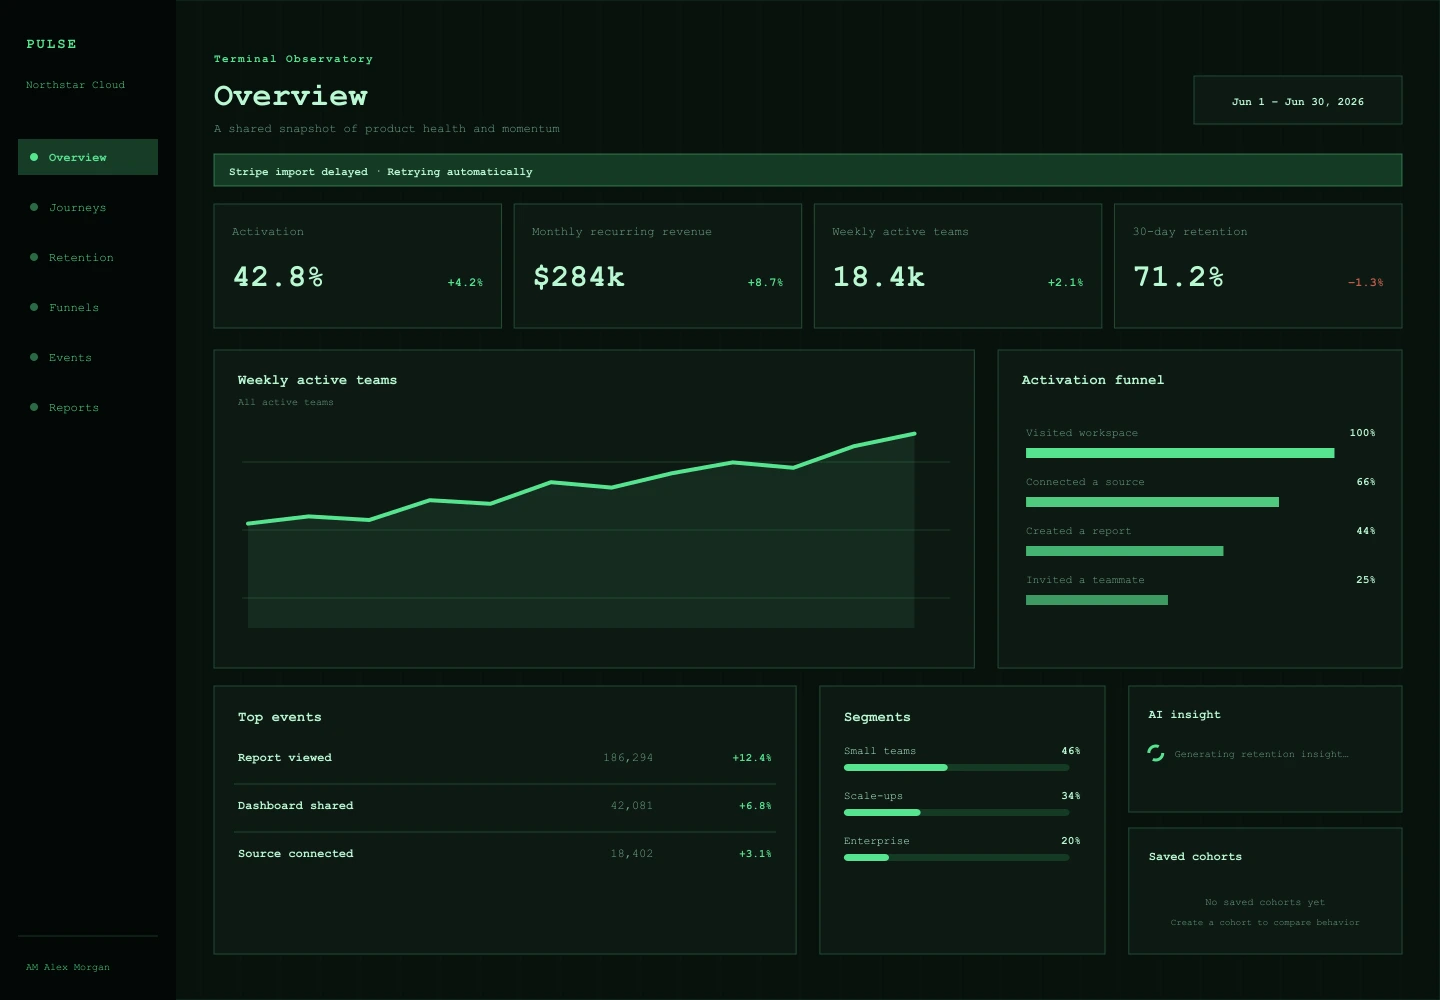
A terminal-influenced observability surface built around precise alignment, green phosphor signals, and visible structure.
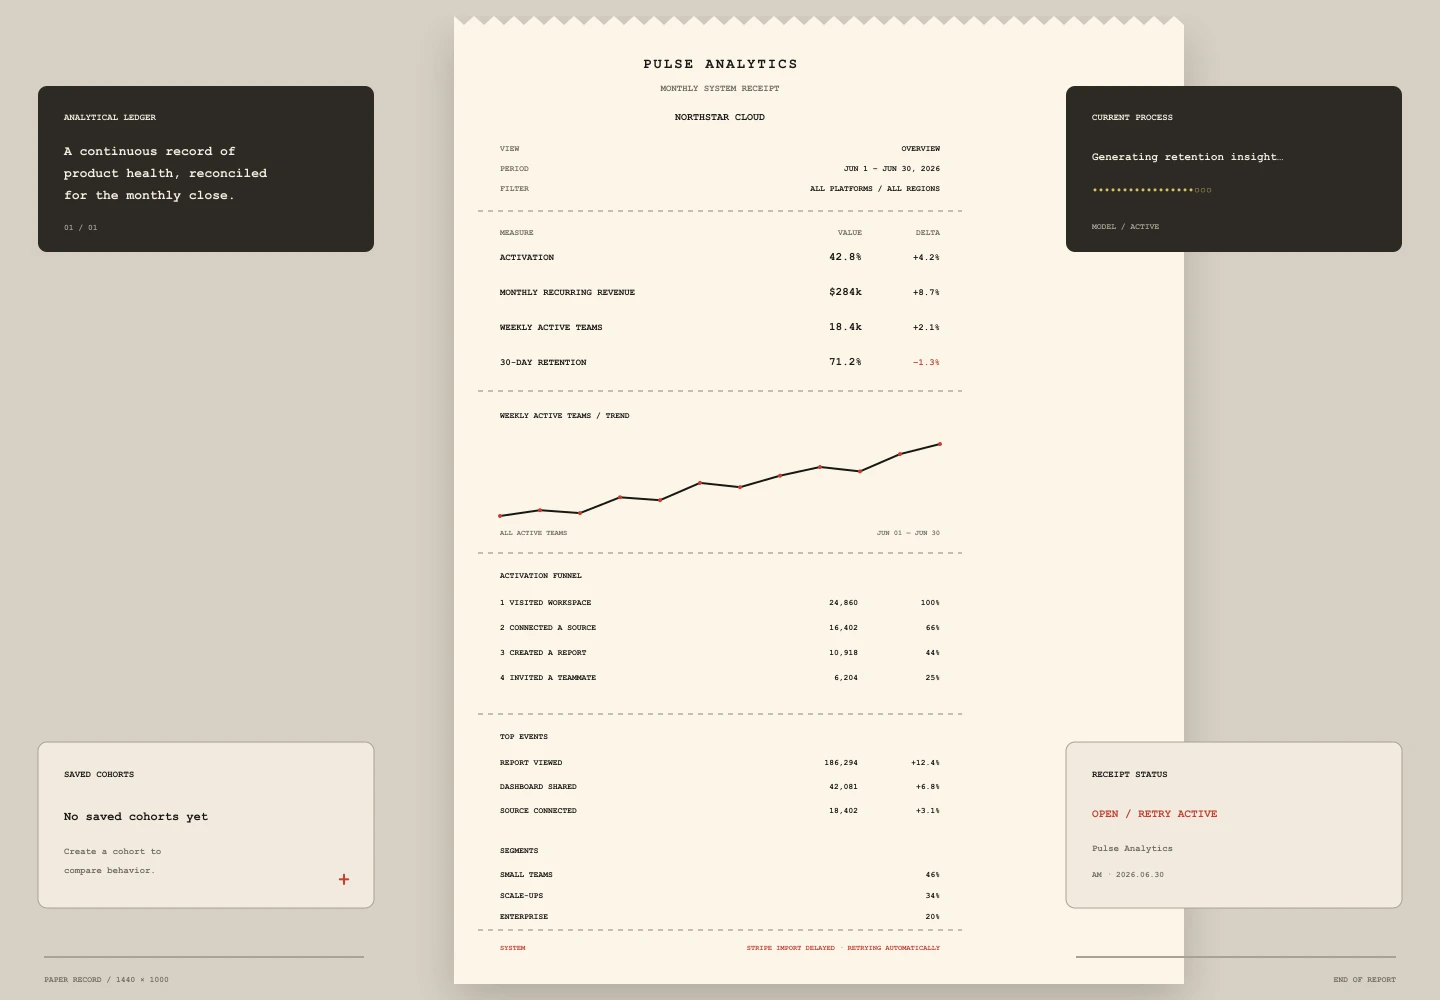
A continuous thermal receipt turns the monthly overview into a tactile, auditable ledger of measures, events, and system notes.
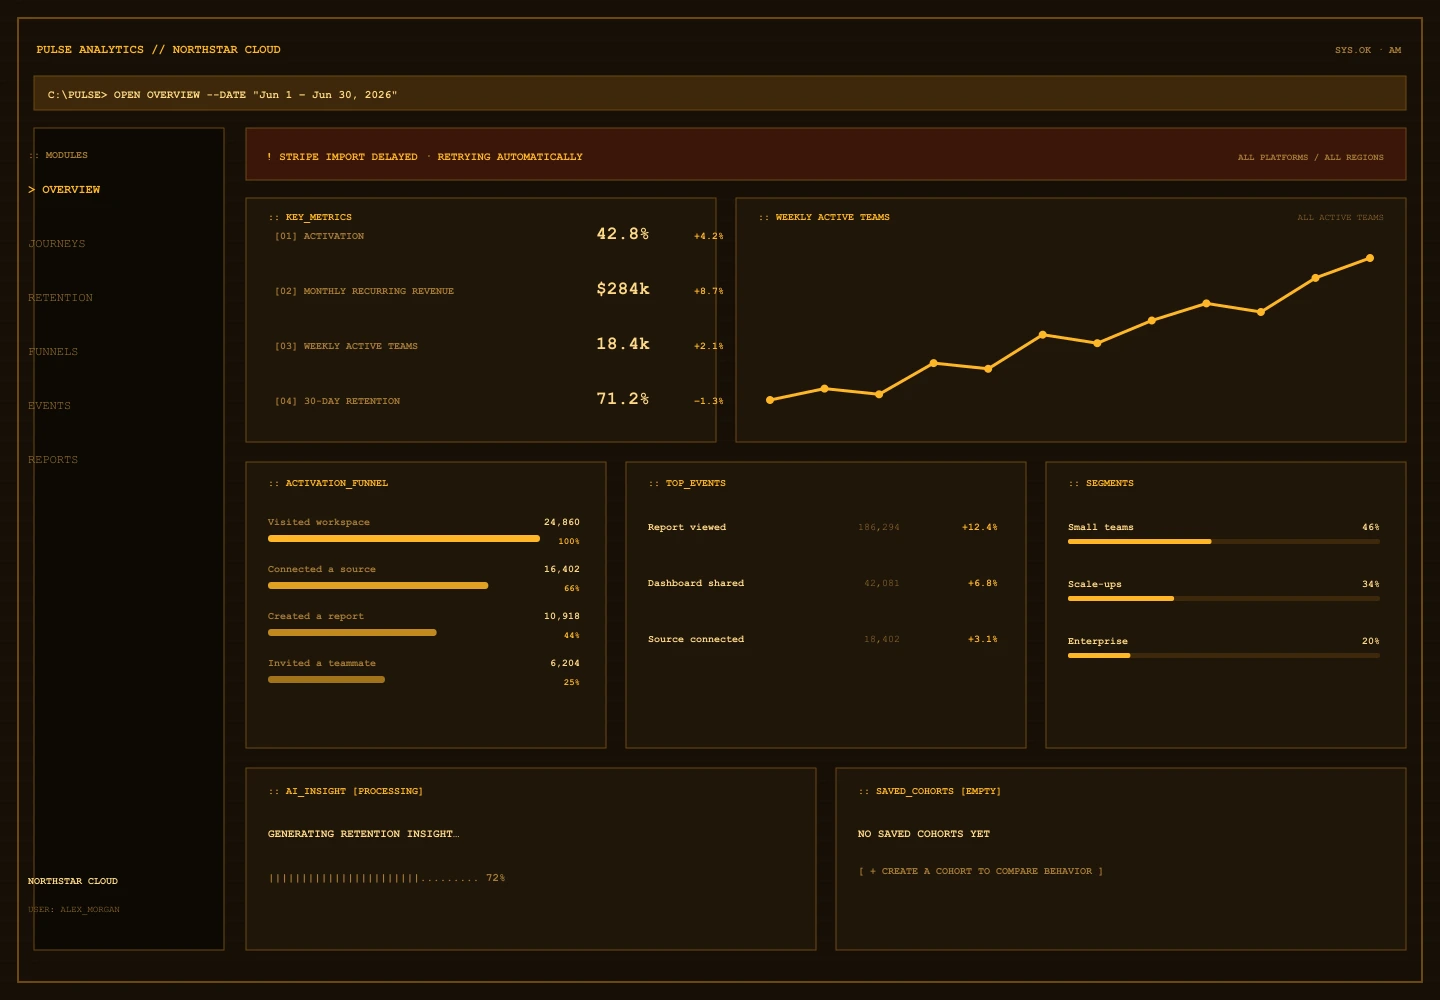
A warm amber command console reframes product analytics as a precise, continuously monitored system.
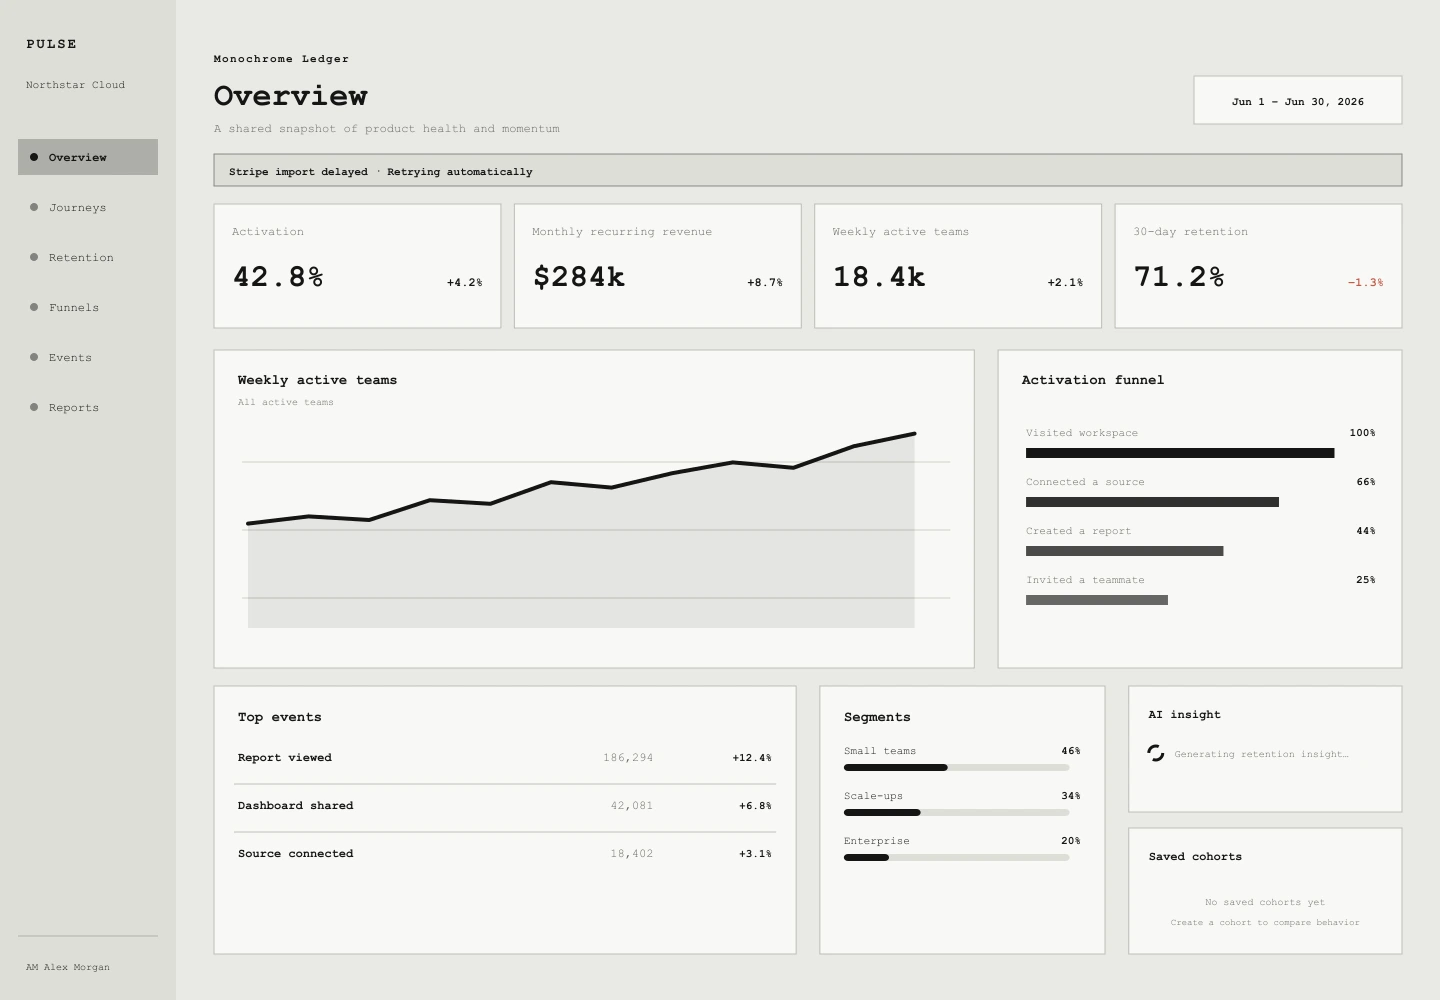
A colorless analytical ledger that asks typography, spacing, and line weight to carry the entire hierarchy.
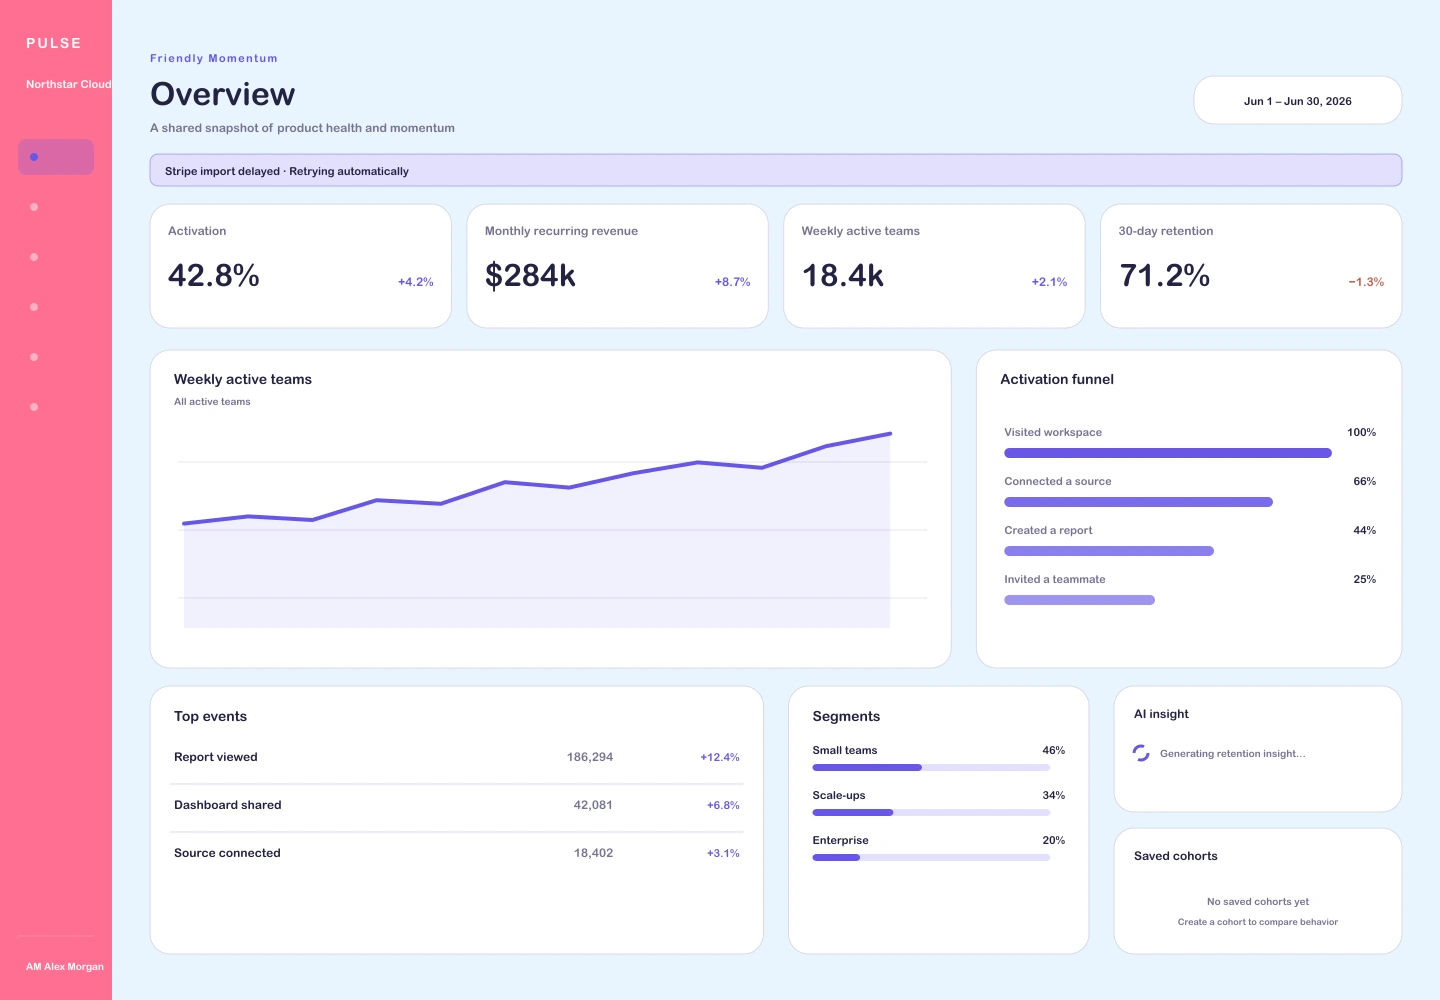
A colorful product-led interpretation designed to make first-time analytics users feel capable quickly.
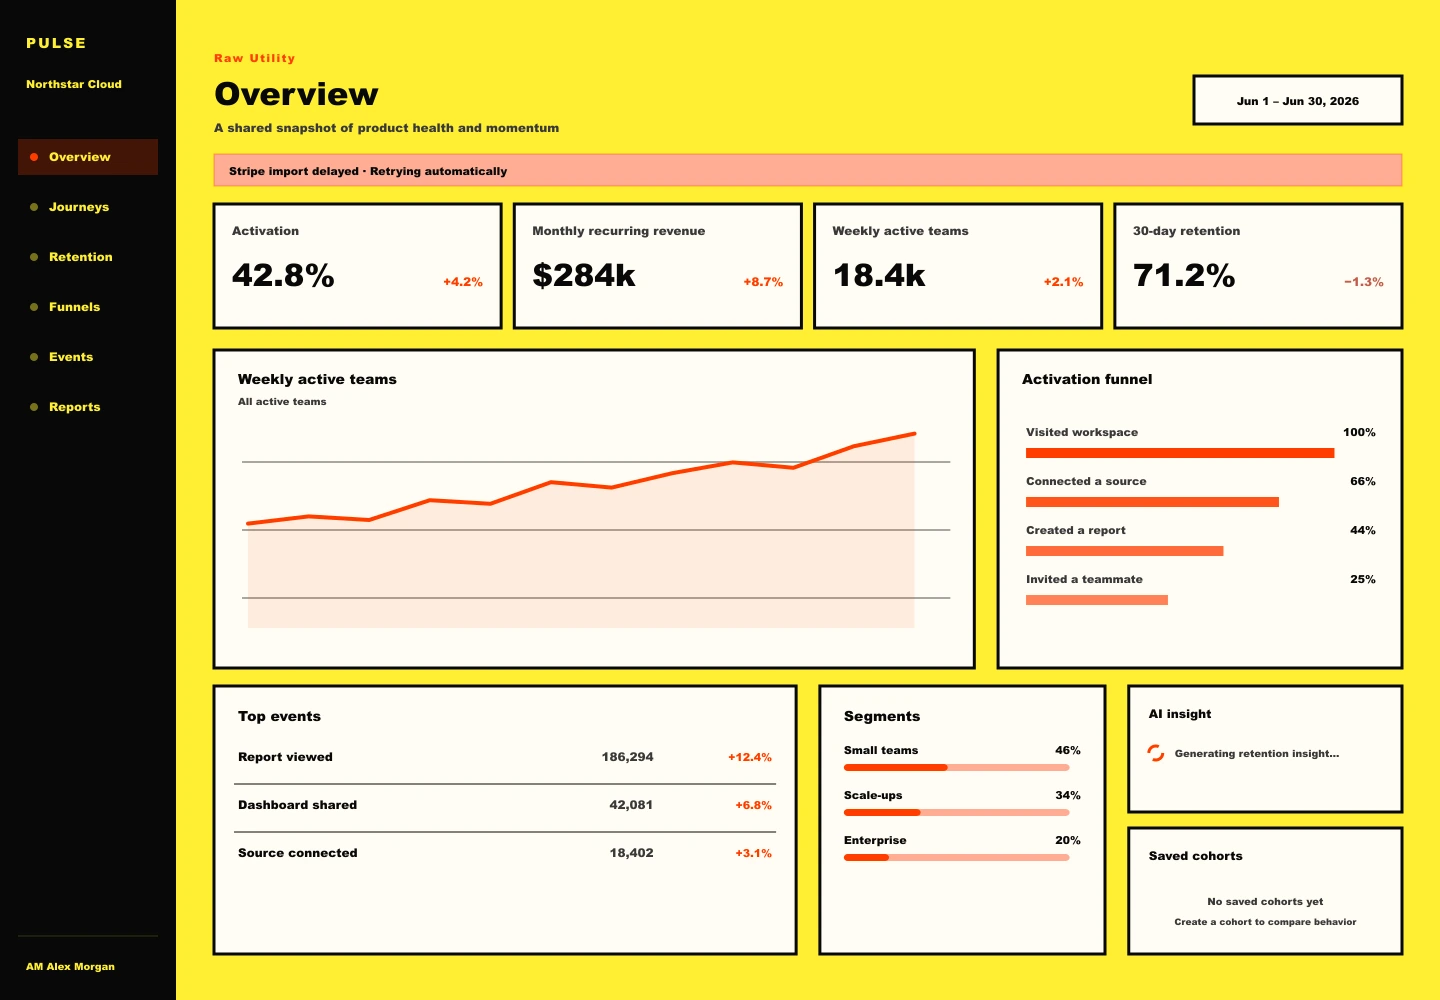
A deliberately blunt interface that turns every panel and action into an unmistakable object.
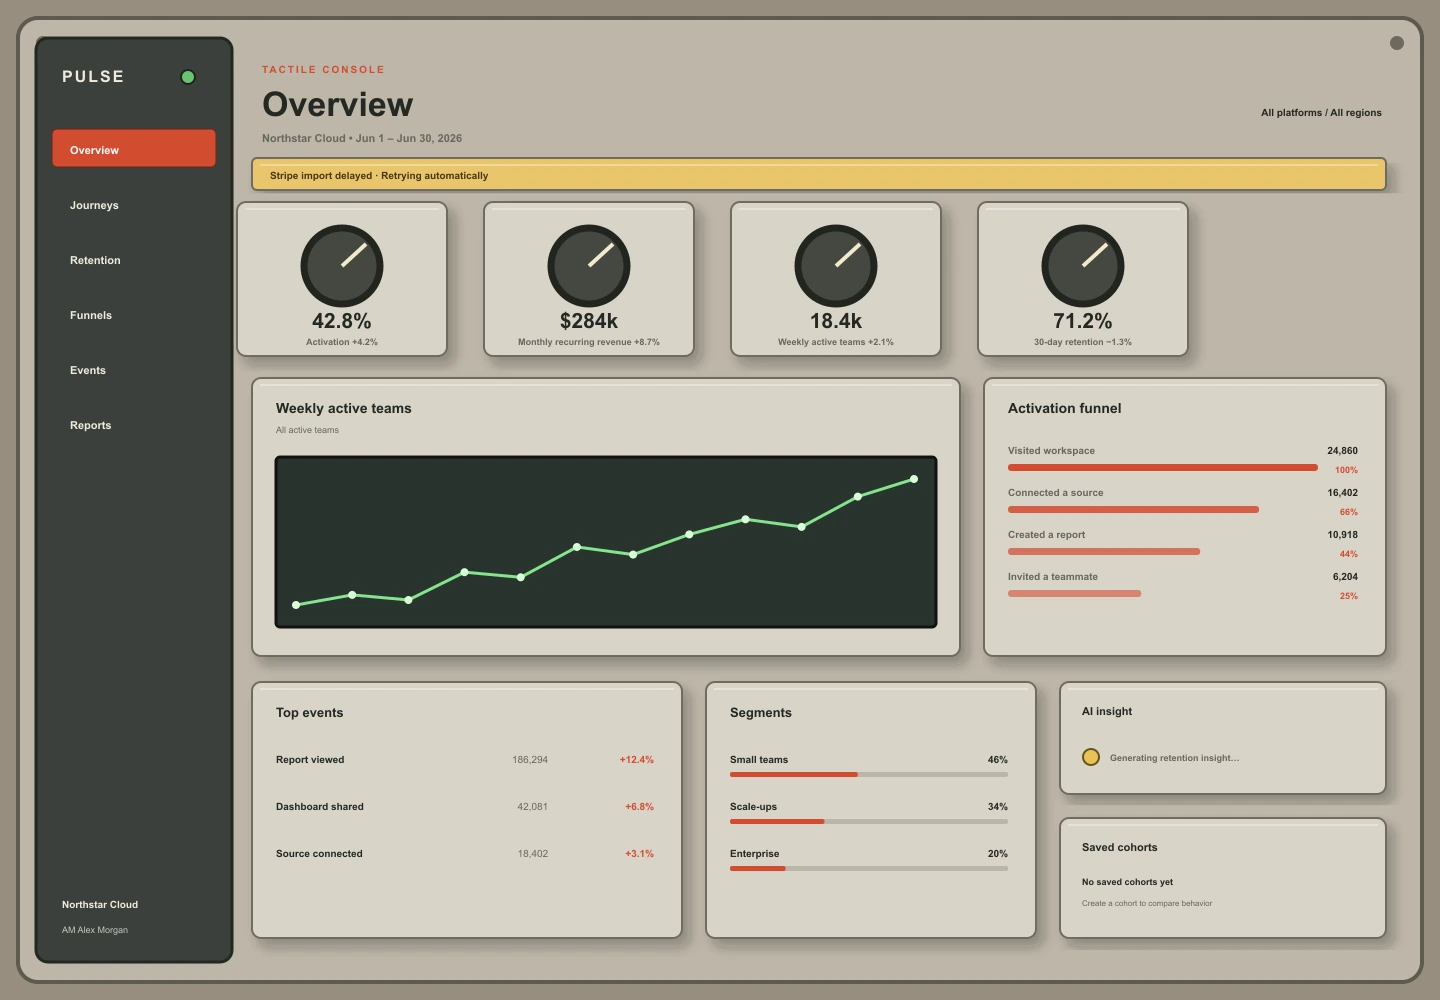
An instrument-inspired workspace gives digital analytics the weight, feedback, and familiarity of physical controls.
Method
Every capture uses the same product-analytics state: identical metrics, warnings, events, segments, loading, and empty states. Layout is the only variable.
That constraint makes this a comparison tool, not a moodboard. Read across the studies to see what each system makes easier—or harder—to understand.